Real-time performance monitoring with Netdata
Multimeter

What cannot be measured cannot be improved. Netdata lets you measure almost anything – at least as long as it's about the performance and health of a Linux computer.
Netdata is a real-time monitoring tool for Linux systems. You can't use Netdata to log a long history of monitored data, but if you're looking for a tool that will let you explore a snapshot of the system state from thousands of different angles, Netdata is a powerful alternative.
You can't ask Netdata for the values for yesterday or even the last hour. In fact, Netdata usually only shows you the last five minutes. However, it displays all measured values from a fast round robin memory in RAM with a resolution of one second. Netdata strives to draw as complete a picture as possible of the performance and health of a computer at the current point in time with minimal expense of computing power and I/O.
Getting Started with Netdata
Netdata is available for Linux, macOS, and FreeBSD. Linux installation is very easy. Several distributions, including Ubuntu, Debian, and openSUSE, make Netdata available in their repositories. If Netdata isn't available through your distro's repositories, you can download the source code from GitHub [1]; an installer script included with the GitHub files makes the installation easy.
Netdata runs as a systemd-managed daemon on the monitored system. By default, you can reach the Netdata browser GUI via http://localhost:1999. An SSH tunnel is useful if you want to access Netdata from another computer. Alternatively, you can run Netdata behind a proxy [2]. You can view the dashboard, which visualizes the measured values, on any other computer that can establish a network connection (Figure 1).
Netdata was originally designed to handle both data acquisition and dashboard representation; however, this approach did not integrate well with cloud environments, where virtual machines are constantly added and removed. Therefore, recent versions of Netdata can also work as a data collector only and delegate display tasks to a central Netdata instance.
Little Configuration
Most Netdata features work without configuration out of the box. The tool supports more than 5,000 metrics without any action on the part of the user, and it comes with some preset limits and preconfigured alarms. In addition to system metrics, Netdata can gather performance data on applications. For instance, Netdata supports a number of database systems, from MySQL to Oracle, plus NoSQL databases such as MongoDB, Redis, CouchDB, and Memcached, and even time-series databases such as Prometheus or Graphite.
Netdata also supports various web servers (Apache, NGINX, lighttpd, and others), mail servers (such as Dovecot, imapd, Amavis, and pop3d), name servers, print servers, time servers, VPN servers, load balancers, and storage systems, such as Ceph, Samba, or NFS. The tool recognizes container hosts (Docker, LXC), backup servers (Rsync, Bacula), and application servers such as Kafka and RabbitMQ. Netdata also supports Java applications.
Administrators can add their own applications under /etc/netdata/apps_groups.conf. You can also define your own charts. In the configuration directory (/etc/netdata) and its subdirectories, you will find several other documented config files that are needed to store user names and passwords for monitored applications.
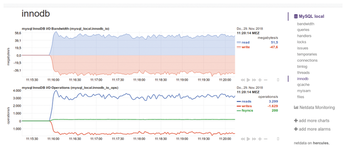
In some cases, you might need to configure Netdata manually to access a specific application. For example, if you wish to monitor MySQL, you need to create a suitable user account with limited rights in the database (see the "Accessing MySQL Data" box).
Accessing MySQL Data
Netdata will need a MySQL user account to monitor MySQL. Enter the commands in Listing 1 to create the account. Then edit /etc/netdata/python.d/mysql.conf and enter netdata as the username without password into one of the existing login templates. Finally, in /etc/netdata/charts.d.conf, remove the comment character from the start of the following line:
mysql=force
After you restart Netdata, numerous new charts will appear for the local MySQL instance (Figure 2).
Listing 1
Creating a Netdata User
mysql> create user 'netdata'@'localhost';
mysql> grant replication client on *.* to 'netdata'@'localhost';
mysql> flush privileges;
Metrics
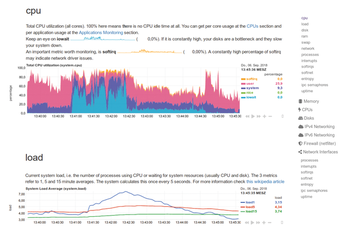
Netdata collects performance data for the classic resource groups CPU, disk, network, and main memory. The information available for this purpose is similar to what you get with a tool like sar from the sysstat package, but with four major differences:
- Values are always instantaneous, although snapshots can be saved so that the period of interest does not scroll off the screen during your analysis.
- All data is visualized in real time.
In addition to absolute values, Netdata provides useful views grouped by application (Figure 3).
Figure 3: Disk I/O grouped by application. Green represents a SQL database on which a benchmark was running.- The graphics are interactive. If the user moves the cursor along the time axis, the measured values are displayed in numbers to the right of the chart.
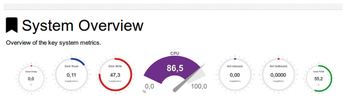
Each chart is preceded by an overview of the basic parameters in the form of level meters displaying swap memory usage, disk read and write operations, and the network, CPU, and RAM usage (Figure 4). Time series diagrams break down these values further. Also included are statistics on processes, interrupts, soft IRQs, or IPC semaphores.
Memory statistics contain charts relating to page faults or the size of the kernel memory structures. The disk statistics show the number of megabytes written and read, as well as the I/O operations per medium, and provide information on the size of the backlog (the I/O operations still outstanding).
The CPU load per core is followed by graphs for the number of interrupts and soft IRQs, again for each virtual CPU. Network statistics show information for packets and errors, individual protocols (TCP, UDP, ICMP), broadcasts, multicasts, and fragmentation (broken down by IPv4 and IPv6). Data is also available for the Netfilter firewall.
Buy this article as PDF
(incl. VAT)
Buy Linux Magazine
US / Canada
UK / Australia
Subscribe to our Linux Newsletters
Find Linux and Open Source Jobs
Subscribe to our ADMIN Newsletters
Support Our Work
Linux Magazine content is made possible with support from readers like you. Please consider contributing when you’ve found an article to be beneficial.

News
-
TUXEDO Computers Unveils Linux Laptop Featuring AMD Ryzen CPU
This latest release is the first laptop to include the new CPU from Ryzen and Linux preinstalled.
-
XZ Gets the All-Clear
The back door xz vulnerability has been officially reverted for Fedora 40 and versions 38 and 39 were never affected.
-
Canonical Collaborates with Qualcomm on New Venture
This new joint effort is geared toward bringing Ubuntu and Ubuntu Core to Qualcomm-powered devices.
-
Kodi 21.0 Open-Source Entertainment Hub Released
After a year of development, the award-winning Kodi cross-platform, media center software is now available with many new additions and improvements.
-
Linux Usage Increases in Two Key Areas
If market share is your thing, you'll be happy to know that Linux is on the rise in two areas that, if they keep climbing, could have serious meaning for Linux's future.
-
Vulnerability Discovered in xz Libraries
An urgent alert for Fedora 40 has been posted and users should pay attention.
-
Canonical Bumps LTS Support to 12 years
If you're worried that your Ubuntu LTS release won't be supported long enough to last, Canonical has a surprise for you in the form of 12 years of security coverage.
-
Fedora 40 Beta Released Soon
With the official release of Fedora 40 coming in April, it's almost time to download the beta and see what's new.
-
New Pentesting Distribution to Compete with Kali Linux
SnoopGod is now available for your testing needs
-
Juno Computers Launches Another Linux Laptop
If you're looking for a powerhouse laptop that runs Ubuntu, the Juno Computers Neptune 17 v6 should be on your radar.