Network monitoring and GPIO control with SNMP
Pins and Nodes

© Lead Image © Julia Borisenko, 123RF.com
Monitor disk space and network and CPU loads with SNMP, view and control Rasp Pi GPIO pins remotely with custom SNMP objects, and create web dashboards with Node-RED.
Some of the great full-featured networking packages like Nagios [1] and MRTG [2] can be loaded on a Raspberry Pi. If, however, you are looking for something a bit smaller in scale, a Simple Network Management Protocol (SNMP) installation and Node-RED is a great place to start. Node-RED [3] is a visual programming environment that lets you create applications by dragging and dropping blocks (nodes) on the screen and directing the logic flow by connecting the nodes together.
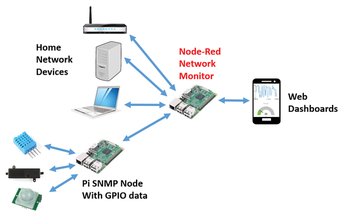
In this article, I look at some basic SNMP monitoring that will allow you to integrate a Raspberry Pi into a larger network (Figure 1).
SNMP
SNMP is the standard for communicating with and monitoring network devices. Common device information is grouped into management information bases (MIBs). Data items are object identifiers (OIDs), referenced by either their MIB name or their OID numeric name. For example, the SNMP device could be queried by its MIB name (e.g., SNMPv2-MIB::sysName.0) or its OID number (e.g., .1.3.6.1.2.1.1.5.0).
Install the SNMP monitor and server on your Rasp Pi with:
sudo apt-get update
sudo apt-get install snmp snmpd snmp-mibs-downloader
To show meaningful MIB names, modify the SNMP config file by opening it in the Nano editor
sudo nano /etc/snmp/snmp.conf
and commenting out the first (#mibs) line. The SNMP server agent has many configuration options. For testing (not recommended in a real system), begin by opening the configuration file and uncommenting the agentAddress line, so all interfaces are open:
sudo nano /etc/snmp/snmpd.conf
 **
# Listen for connections on all interfaces (both IPv4 *and* IPv6)
agentAddress udp:161,udp6:[::1]:161
In the ACCESS CONTROL section, add a line to give read/write access to the public and comment out all other access control definitions:
# ACCESS CONTROL
#
# Set read/write access to public anywhere
#
rwcommunity public
After saving the changes you've made to snmpd.conf, the service needs to be restarted:
sudo service snmpd restart
A number of useful SNMP command-line programs are available (Table 1). The basic syntax for these commands is:
Table 1
SNMP CLI Programs
| Program | Function |
|---|---|
| snmpget |
Gets an SNMP message for a specific OID. |
| snmpset |
Sets an SNMP OID (OID needs to be writable). |
| snmpwalk |
Gets multiple OID values in an MIB tree. |
command -c <community> -v <version> <node> <OID>
To begin, test SNMP on the Rasp Pi to see if it is working by running the snmpwalk command, starting at the top of the tree (.1.3); it should return a long list of all the available SNMP OIDs (Listing 1).
Listing 1
Testing SNMP
Node-RED
Node-RED has been preinstalled on Raspbian Jesse since the November 2015 version. For this networking example, you will need to load the Node-RED SNMP module, dashboard, and timer library by entering:
sudo apt-get update
sudo apt-get install npm
cd $HOME/.node-red
npm install node-red-node-snmp
npm install node-red-dashboard
npm install node-red-contrib-bigtimer
At a terminal window, you can start Node-RED with:
node-red-start &
Node-RED has a web configuration interface that is accessed at http://localhost:1880 or http://<pi_ip_address>:1880.
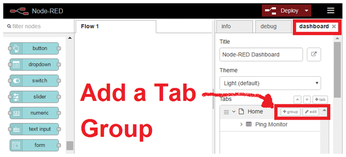
A good first Node-RED application is to make a web dashboard that shows ping (node-to-node) delay times. The dashboards are defined in the right panel of Node-RED (Figure 2). Dashboard items are put into groups, and groups are put into tabs. Each tab will be shown as a separate page on your smartphone.
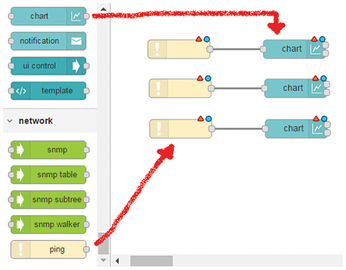
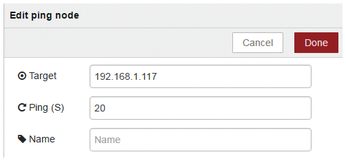
The logic is created by dragging and dropping ping and chart nodes onto the flow sheet (Figure 3) and then wiring the ping outputs to the chart inputs. Next, double-click the ping node and enter the IP address of the node to ping and the scan rate (Figure 4). Similarly, double-click the chart node and enter the dashboard group, size, label, and chart time (Figure 5).
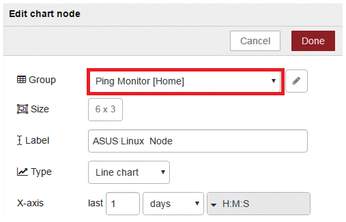
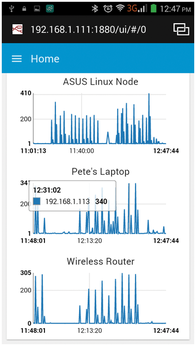
After the configuration is done, click the Deploy button on the Node-RED menubar. The Node-RED dashboard user interface is accessed at http:<IPaddress>:1880/ui (e.g., http://192.168.1.102:1880/ui). Figure 6 shows the final dashboard. Chart data values are shown by clicking on the chart line.
Node-RED SNMP Example
The ping node is quite simple, returning just the ping value. The snmp node is more complex, returning multiple pieces of information. To use snmp nodes in a Node-RED application, you need some support nodes to parse and pass the payload messages. Sending SNMP data to a chart dashboard (Figure 7) uses the following nodes:
Big Timer– Triggers the polling of data.snmp– Gets SNMP and OID information.split– Splits the message into addressable variables.change– Puts the OID value into the message payload.chart– Shows the payload.
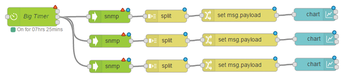
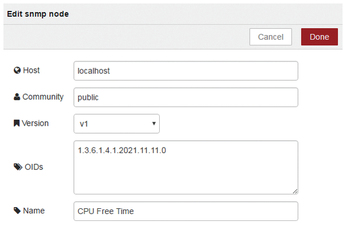
The Big Timer node has many useful options. For a simple one-minute monitoring circuit, the middle Big Timer output pin is connected as an input to the snmp node. The snmp node needs a host, community, and numeric OID configuration (Figure 8). The split node should be set up to split on a comma (,).
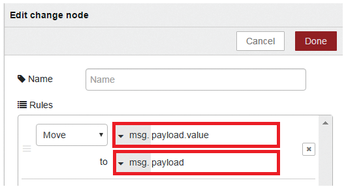
The powerful change node can adjust and move information within the msg and payload items. For this application, you need to move payload.value to payload (Figure 9). Like the ping example, the chart node is configured as a line chart with the required labels and ranges.
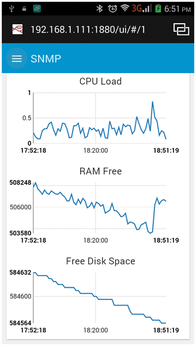
Many other SNMP objects can be monitored. Table 2 shows some of the more commonly monitored objects, and the dashboard in Figure 10 shows the typical output of monitoring CPU load, total RAM free, and free disk space.
Table 2
Useful SNMP Objects to Monitor
| Object | OID |
|---|---|
| One-minute CPU load |
.1.3.6.1.4.1.2021.10.1.3.1 |
| Five-minute CPU load |
.1.3.6.1.4.1.2021.10.1.3.2 |
| 15-minute CPU load |
.1.3.6.1.4.1.2021.10.1.3.3 |
| Idle CPU time (%) |
.1.3.6.1.4.1.2021.11.11.0 |
| Total RAM in machine |
.1.3.6.1.4.1.2021.4.5.0 |
| Total RAM used |
.1.3.6.1.4.1.2021.4.6.0 |
| Total RAM free |
.1.3.6.1.4.1.2021.4.11.0 |
| Total disk/partition size (KB) |
.1.3.6.1.4.1.2021.9.1.6.1 |
| Available space on disk |
.1.3.6.1.4.1.2021.9.1.7.1 |
| Used space on disk |
.1.3.6.1.4.1.2021.9.1.8.1 |
Buy this article as PDF
(incl. VAT)
Buy Linux Magazine
US / Canada
UK / Australia
Subscribe to our Linux Newsletters
Find Linux and Open Source Jobs
Subscribe to our ADMIN Newsletters
Support Our Work
Linux Magazine content is made possible with support from readers like you. Please consider contributing when you’ve found an article to be beneficial.

News
-
TUXEDO Computers Unveils Linux Laptop Featuring AMD Ryzen CPU
This latest release is the first laptop to include the new CPU from Ryzen and Linux preinstalled.
-
XZ Gets the All-Clear
The back door xz vulnerability has been officially reverted for Fedora 40 and versions 38 and 39 were never affected.
-
Canonical Collaborates with Qualcomm on New Venture
This new joint effort is geared toward bringing Ubuntu and Ubuntu Core to Qualcomm-powered devices.
-
Kodi 21.0 Open-Source Entertainment Hub Released
After a year of development, the award-winning Kodi cross-platform, media center software is now available with many new additions and improvements.
-
Linux Usage Increases in Two Key Areas
If market share is your thing, you'll be happy to know that Linux is on the rise in two areas that, if they keep climbing, could have serious meaning for Linux's future.
-
Vulnerability Discovered in xz Libraries
An urgent alert for Fedora 40 has been posted and users should pay attention.
-
Canonical Bumps LTS Support to 12 years
If you're worried that your Ubuntu LTS release won't be supported long enough to last, Canonical has a surprise for you in the form of 12 years of security coverage.
-
Fedora 40 Beta Released Soon
With the official release of Fedora 40 coming in April, it's almost time to download the beta and see what's new.
-
New Pentesting Distribution to Compete with Kali Linux
SnoopGod is now available for your testing needs
-
Juno Computers Launches Another Linux Laptop
If you're looking for a powerhouse laptop that runs Ubuntu, the Juno Computers Neptune 17 v6 should be on your radar.