Filtering log messages with Splunk
Steadily Refined
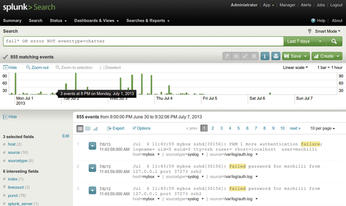
For this month's column, I installed Splunk at home on my Ubuntu machine. Figure 1 shows how I searched the log data in /var/log and the Apache access logs provided by my hosting provider, which I copied using rsync. Without any ado, Splunk consumed rotated and zipped logs as well.
The first query I issued was fail* OR error. This full-text search finds messages that contain the term error. Splunk is not case sensitive for search strings, but it does expect keywords, such as OR, to be uppercase. The regular expression fail* matches all terms that begin with fail – including failed. Without keywords, Splunk connects the strings with a logical AND; foo bar thus finds log entries that contain both foo and bar. The logical operator OR must be written all in uppercase and combines messages that contain either search term. The results in Figure 1 cover the time frame shown at top right, Last 7 days.
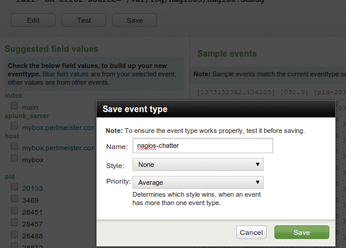
All of these results are from the extremely verbose Nagios debug log (nagios.debug). To filter them, the dialog in Figure 4 defines the nagios-chatter event type with the search function source=.../nagios.debug (seen on the darkened background). Splunk then internally associates all entries from the original nagios.debug file with the event type. If you then append the expression NOT eventtype=nagios-chatter to the query, the event search filters out any Nagios chatter.
The next application spamming the logfiles was my nightly backup process. The rsync command I used here seemed to be unable to copy some files because of a lack of access rights, which filled the backup.all.log file every night. Thus, I needed an event type called rsync-chatter to filter that out.
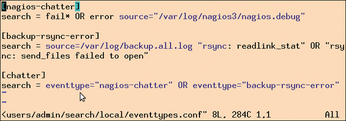
To keep the search commands short, I defined the chatter event type, which uses
eventtype="nagios-chatter" OR
eventtype="rsync-error"
to combine the two filters. This means that I just need to append NOT eventtype=chatter to my query to hide all this log chatter with the help of an arbitrarily extensible filter. The messages from /var/log/messages shown in Figure 5 remain; they report failed password attempts and seem to merit deeper manual analysis.
Scaling with Hadoop
Sure, you could argue that instead of reading a mess of data in /var/log, it would be easier just to read the correct file, /var/log/auth.log. The great advantage of Splunk, though, is precisely that it stores all (!) your logfiles – even those from entire server farms – and lets you run queries against them all at once.
For this approach to work well in large data centers, Splunk uses a Hadoop cluster [2] [3] as its back end, which distributes the complicated computation of the search results across multiple nodes.
The web interface allows end users without programming skills to select fields and define limiting filters graphically. Splunk permanently stores all user entries in the configuration files in etc under the Splunk installation directory (Figure 6). As you gradually develop your own definitions, you would do well to back up these files with a source control system such as Git occasionally, so you can roll back if you realize that what you just changed was a bad idea.
The Poor Developer's Splunk Alert
Unlike the enterprise version, the free version of Splunk does not provide alerts that notify the user when queries exceed set limits. The script in Listing 1 [4], however, will help those on a more frugal budget; it runs on the same machine and periodically taps into Splunk's web API. Splunk sends the results in JSON format, and the script reformats them and mails them out. In other words, Splunk can run on your home computer behind a firewall, while a local cronjob periodically fires off queries and sends the results to a recipient anywhere on the Internet.
Listing 1
daily-incidents
To begin, the script in Listing 1 needs to identify itself to the Splunk REST API. A fresh installation sets admin (account) and changeme (password) for the web GUI by default. The script executes the login as an HTTPS request. Line 11 defines the server running the REST API as 127.0.0.1; line 12 sets the Splunk server port to 8089.
The post() method called in line 31 uses SSL to send the login data to Splunk. Because the LWP::UserAgent CPAN module does not come with browser certificates by default, line 29 sets the verify_ hostname option to 0, which prevents the certificate check from happening.
Splunk returns the results of the login as XML, and the XMLin() function from the CPAN XML::Simple module in the script converts the XML into a data structure. After a successful login, the structure contains a sessionKey field. The key contains a hexadecimal number that must accompany each following REST request for Splunk to recognize it as belonging to a logged-in user. The UserAgent's default_headers() method handles this automatically for all subsequent requests.
The tutorial on the Splunk website [5] describes the details of the REST API. Although the Splunk SDK has client libraries for Python, Java, JavaScript, PHP, Ruby, and C#, it lacks a Perl kit. A module is available on CPAN, but it does not work with Splunk version 5. Fortunately, REST queries are easy to program, and Listing 1 thus uses this layer.
« Previous 1 2 3 Next »
Buy this article as PDF
(incl. VAT)
Buy Linux Magazine
US / Canada
UK / Australia
Subscribe to our Linux Newsletters
Find Linux and Open Source Jobs
Subscribe to our ADMIN Newsletters
Support Our Work
Linux Magazine content is made possible with support from readers like you. Please consider contributing when you’ve found an article to be beneficial.

News
-
Linux Servers Targeted by Akira Ransomware
A group of bad actors who have already extorted $42 million have their sights set on the Linux platform.
-
TUXEDO Computers Unveils Linux Laptop Featuring AMD Ryzen CPU
This latest release is the first laptop to include the new CPU from Ryzen and Linux preinstalled.
-
XZ Gets the All-Clear
The back door xz vulnerability has been officially reverted for Fedora 40 and versions 38 and 39 were never affected.
-
Canonical Collaborates with Qualcomm on New Venture
This new joint effort is geared toward bringing Ubuntu and Ubuntu Core to Qualcomm-powered devices.
-
Kodi 21.0 Open-Source Entertainment Hub Released
After a year of development, the award-winning Kodi cross-platform, media center software is now available with many new additions and improvements.
-
Linux Usage Increases in Two Key Areas
If market share is your thing, you'll be happy to know that Linux is on the rise in two areas that, if they keep climbing, could have serious meaning for Linux's future.
-
Vulnerability Discovered in xz Libraries
An urgent alert for Fedora 40 has been posted and users should pay attention.
-
Canonical Bumps LTS Support to 12 years
If you're worried that your Ubuntu LTS release won't be supported long enough to last, Canonical has a surprise for you in the form of 12 years of security coverage.
-
Fedora 40 Beta Released Soon
With the official release of Fedora 40 coming in April, it's almost time to download the beta and see what's new.
-
New Pentesting Distribution to Compete with Kali Linux
SnoopGod is now available for your testing needs