Analyzing network traffic with Tshark
Plumbing the Depths
Without specifying additional parameters, the program displays all data traffic that flows through the selected interface. In some cases, however, you aren't interested in all data and might rather focus on a specific protocol, such as HTTP, Samba, or NFS connections. Tshark can employ various filtering options, and you can combine several of these options for complex filtering scenarios.
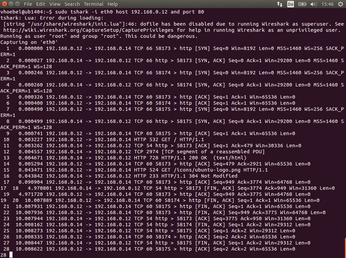
In the following scenario, an Apache web server that provides several websites for an intranet is listening on the local system with an IP address of 192.168.0.14 on the eth0 interface. A user on the computer with the IP address 192.168.0.12 reports problems with the connection. You can investigate this problem on the server using the call in the first line of Listing 5.
Listing 5
Checking Traffic
You can restrict the analysis to the eth0 interface using the -i eth0 parameter; specifying host 192.168.0.12 means you will only study packets that run from or to this IP address. The port 80 switch focuses on HTTP traffic, and the keyword and combines the two parameters, host and port.
Figure 3 shows how the HTTP connection is established successfully through a TCP handshake [6]. You'll need to fish the actual HTTP data traffic (frames 10, 13, and 15) out of the substantial output.
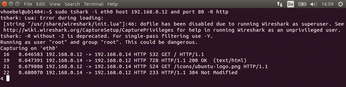
Using read filters provides a better overview. Read filters make it possible to restrict the flood of packets using specified criteria. For example, you might only want to monitor the relevant processes in the HTTP protocol (Listing 5, line 2). Figure 4 shows how the network node 102.168.0.12 accesses the site using the HTTP GET method (frame 16); the web server at the IP address 192.168.0.14 responds with an HTTP status 200 and serves up the page (frames 19, 21, and 22).
The read filter also provides much more powerful possibilities for selecting specific data streams. You can find other examples [7] and detailed descriptions [8] online.
Details
Observing the data flow and subsequent analysis is often enough to troubleshoot problems. In some cases, however, it is necessary to examine the contents of the packages – the payload – in hexadecimal or ASCII form. If the data traffic you are sniffing is unencrypted on the wire, Tshark will display the hexadecimal data with the -x switch (Listing 5, line 3). Figure 5 shows the output.
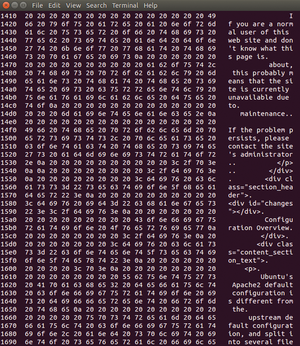
The program always considers each package individually, and therefore displays the frames in their own blocks. The example in Figure 5 is the default page that appears after installing an Apache web server on Ubuntu 14.04.
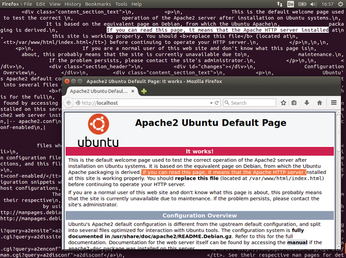
In some cases, it is better to refrain from displaying hexadecimal values for reasons of readability and, instead, expand the output with the text field. Use the switch combination -T fields -e text (Listing 5, line 4). Figure 6 shows the website as HTML source code. With very little effort, it is possible to use this output to rebuild a part of the transferred website.
Tips
Tshark provides the necessary default settings to enable fast analysis of data traffic. You can also use Tshark to troubleshoot many protocols and applications. For example, the official Samba wiki recommends the following command to monitor Samba connections:
$ sudo tshark -p -w file_name port 445 or port 139
The -w switch tells Tshark to write the output not to the console but instead to a file [9] for further processing.
The official Wireshark wiki provides tips for analyzing SMB traffic [10]. You will also find comprehensive instructions for analyzing NFS, SMTP, MySQL, and VoIP, as well as other protocols. In most cases with such searches, you will come across corresponding read filters that you can use to see only the relevant packages.
In this article, I focused on observing wired data traffic. If you also want to use Tshark for analyzing WiFi networks, the comprehensive online documentation will give you some pointers [11]. Tshark can even analyze Bluetooth connections [12] and USB traffic [13].
« Previous 1 2 3 Next »
Buy this article as PDF
(incl. VAT)
Buy Linux Magazine
US / Canada
UK / Australia
Subscribe to our Linux Newsletters
Find Linux and Open Source Jobs
Subscribe to our ADMIN Newsletters
Support Our Work
Linux Magazine content is made possible with support from readers like you. Please consider contributing when you’ve found an article to be beneficial.

News
-
TUXEDO Computers Unveils Linux Laptop Featuring AMD Ryzen CPU
This latest release is the first laptop to include the new CPU from Ryzen and Linux preinstalled.
-
XZ Gets the All-Clear
The back door xz vulnerability has been officially reverted for Fedora 40 and versions 38 and 39 were never affected.
-
Canonical Collaborates with Qualcomm on New Venture
This new joint effort is geared toward bringing Ubuntu and Ubuntu Core to Qualcomm-powered devices.
-
Kodi 21.0 Open-Source Entertainment Hub Released
After a year of development, the award-winning Kodi cross-platform, media center software is now available with many new additions and improvements.
-
Linux Usage Increases in Two Key Areas
If market share is your thing, you'll be happy to know that Linux is on the rise in two areas that, if they keep climbing, could have serious meaning for Linux's future.
-
Vulnerability Discovered in xz Libraries
An urgent alert for Fedora 40 has been posted and users should pay attention.
-
Canonical Bumps LTS Support to 12 years
If you're worried that your Ubuntu LTS release won't be supported long enough to last, Canonical has a surprise for you in the form of 12 years of security coverage.
-
Fedora 40 Beta Released Soon
With the official release of Fedora 40 coming in April, it's almost time to download the beta and see what's new.
-
New Pentesting Distribution to Compete with Kali Linux
SnoopGod is now available for your testing needs
-
Juno Computers Launches Another Linux Laptop
If you're looking for a powerhouse laptop that runs Ubuntu, the Juno Computers Neptune 17 v6 should be on your radar.