Monitor your old Linux devices
Remote Commands
Rather than having remote Linux servers send data to a central monitoring node, the central node can periodically poll the remote servers for data.
SSH can be used to run remote commands; however, SSH needs you to enter a password. Although this is fine for manual testing, for automated polling it is a problem. Two solutions to this problem are:
ssh-keygen, which generates an SSH key pair that is stored in a user directory, enabling the standard SSH client to run without you having to enter a password.sshpass, which is an SSH client that includes the username/password as a command-line option.
The ssh-keygen approach is recommended for most applications because it does not expose passwords. For testing, I use the sshpass method, and in the Node-RED project that follows, I use the ssh-keygen approach. The sshpass command is included in many standard distributions. To install it, enter:
sudo apt-get install sshpass
Listing 3 shows how to get CPU (line 1) and hard drive (line 13) temperatures.
Listing 3
CPU and Hard Drive Temps
01 $ sshpass -p mypassword ssh username@192.168.0.116 sensors
02 dell_smm-virtual-0
03 Adapter: Virtual device
04 Processor Fan: 3044 RPM
05 CPU:            +31.0°C
06 Ambient:        +33.0°C
07 SODIMM:         +33.0°C
08
09 acpitz-virtual-0
10 Adapter: Virtual device
11 temp1:        +51.5°C  (crit = +107.0°C)
12
13 $ sshpass -p mypassword ssh username@192.168.0.116 hddtemp /dev/sda
14 /dev/sda: HTS548040M9AT00: 39°C
As you saw earlier, grep and awk calls can be used to show just the required values for the CPU:
$ sshpass -p mypassword ssh username@192.168.0.116 sensors | grep temp1 | awk '{print $2}'
+30.5°C
and for the hard drive:
$ sshpass -p mypassword ssh username@192.168.0.116 hddtemp /dev/sda | awk '{print $3}'
39°C
At this point, a mechanism is available to get key monitoring values from remote Linux nodes. The next step is to pass these values to a Node-RED dashboard.
Node-RED Dashboard
Node-RED [4] is a web-based visual programming environment with a wide variety of nodes that can be wired together to create logic. On the Raspberry Pi platform, Node-RED is pre-installed in Raspbian images. To install Node-RED on other systems see the Get Started docs [5].
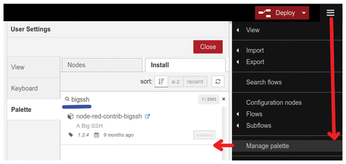
For this project I installed two nodes: bigssh, an SSH node that saves and uses ssh-keygen credentials, and bigtimer, a timer node that schedules data polling. These components can be installed either manually or with the Manage palette menu option (Figure 2).

A basic test circuit to poll a Linux server manually and return a temperature would use an Inject, a bigssh, and a Debug node (Figure 3). The Inject node is used to pulse the logic.

By double-clicking on the bigssh node, an Edit configuration window opens. In the myssh field, you enter the username, host, and ssh-keygen password. The bigssh node passes its first output (commandLine) to a Debug node. The Debug node sends message and payload information to the Debug tab. If the Debug node does not show the expected SSH command result, then the bigssh third output (minError) shows the error output.
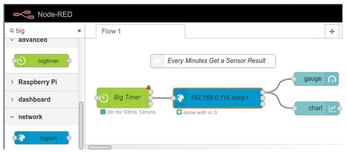
After I was able to get all my SSH commands working successfully in the test logic, I changed the logic to use a bigtimer node for scheduling and some dashboard nodes for display (Figure 4). The bigtimer node has a good selection of scheduling and timing functions. Of the three Big Timer outputs, the middle output pin generates a pulse every minute.

You have the choice of a number of dashboard presentations. For a simple first pass, I used gauge and chart nodes. Double-click on each of these dashboard nodes to edit properties like labels and scales.
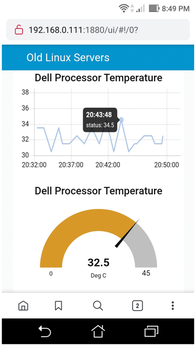
After the logic is complete, click the Deploy button on the right side of the menubar to run your updated project. The Node-RED web dashboard is at http://<your-node-red-ip>:1880/ui/ (Figure 5).

Final Comment
In this article, I only looked at three command-line utilities; however, many others commands could use this technique.
Infos
- iostat: http://man7.org/linux/man-pages/man1/iostat.1.html
- lm-sensors: https://github.com/lm-sensors/lm-sensors
- hddtemp: https://linux.die.net/man/8/hddtemp
- Node-RED documentation: https://flows.nodered.org/
- Getting started with Node-RED: https://nodered.org/#get-started
« Previous 1 2
Buy this article as PDF
(incl. VAT)
Buy Linux Magazine
Subscribe to our Linux Newsletters
Find Linux and Open Source Jobs
Subscribe to our ADMIN Newsletters
Support Our Work
Linux Magazine content is made possible with support from readers like you. Please consider contributing when you’ve found an article to be beneficial.

News
-
Linux Servers Targeted by Akira Ransomware
A group of bad actors who have already extorted $42 million have their sights set on the Linux platform.
-
TUXEDO Computers Unveils Linux Laptop Featuring AMD Ryzen CPU
This latest release is the first laptop to include the new CPU from Ryzen and Linux preinstalled.
-
XZ Gets the All-Clear
The back door xz vulnerability has been officially reverted for Fedora 40 and versions 38 and 39 were never affected.
-
Canonical Collaborates with Qualcomm on New Venture
This new joint effort is geared toward bringing Ubuntu and Ubuntu Core to Qualcomm-powered devices.
-
Kodi 21.0 Open-Source Entertainment Hub Released
After a year of development, the award-winning Kodi cross-platform, media center software is now available with many new additions and improvements.
-
Linux Usage Increases in Two Key Areas
If market share is your thing, you'll be happy to know that Linux is on the rise in two areas that, if they keep climbing, could have serious meaning for Linux's future.
-
Vulnerability Discovered in xz Libraries
An urgent alert for Fedora 40 has been posted and users should pay attention.
-
Canonical Bumps LTS Support to 12 years
If you're worried that your Ubuntu LTS release won't be supported long enough to last, Canonical has a surprise for you in the form of 12 years of security coverage.
-
Fedora 40 Beta Released Soon
With the official release of Fedora 40 coming in April, it's almost time to download the beta and see what's new.
-
New Pentesting Distribution to Compete with Kali Linux
SnoopGod is now available for your testing needs

