Monitor resource contention with Pressure Stall Information
Memory and I/O
The two other files, memory and io, each return two lines. The first line starts with some; the second with full. The some values show the portion of time in which at least one process is stalled, and the full values show the time in which all non-idle processes are stalled simultaneously. According to the documentation at the Kernel.org site, the full state means that "…actual CPU cycles are going to waste, and the workload that spends extended time in this state is considered to be thrashing." Listing 3 shows an example of a 2-socket compute node with an AMD EPYC 7551 and a total of 128 threads.
Listing 3
Measuring with memory and io
$ grep -R . /proc/pressure/
/proc/pressure/io:some avg10=0.00 avg60=0.00 avg300=0.00 total=10587199096
/proc/pressure/io:full avg10=0.00 avg60=0.00 avg300=0.00 total=10072568253
/proc/pressure/cpu:some avg10=30.27 avg60=29.97 avg300=18.80 total=1620253162
/proc/pressure/memory:some avg10=0.00 avg60=0.00 avg300=0.00 total=15411
/proc/pressure/memory:full avg10=0.00 avg60=0.00 avg300=0.00 total=12389
$ uptime
07:24:59 up 2 days, 16:15,  1 user,  load average: 150.58, 118.00, 76.42
A large full value in memory can mean that the system was unable to handle a single runnable process in this time and that the CPU was probably busy paging. The overloaded backup server in Listing 4 illustrates this nicely. In this example, logging onto the system with SSH took more than a minute.
Listing 4
Overloaded Backup Server
$ grep -R . /proc/pressure/
/proc/pressure/io:some avg10=15.60 avg60=11.13 avg300=7.98 total=94192093351
/proc/pressure/io:full avg10=15.60 avg60=11.13 avg300=7.97 total=93713900789
/proc/pressure/cpu:some avg10=0.00 avg60=0.00 avg300=0.00 total=1159442298
/proc/pressure/memory:some avg10=67.79 avg60=67.80 avg300=72.51 total=618948360599
/proc/pressure/memory:full avg10=67.60 avg60=67.58 avg300=72.18 total=613900281165
Polling
The Linux PSI interface lets admins generate triggers by writing them to the files and then reading them with poll(). Listing 5 breaks down the syntax; the values for the stall amount and the time window are in microseconds.
Listing 5
Polling Syntax
some|full Stall_Amount Time_Window
Listing 6 shows an example of a monitoring program from the Linux documentation [4]. The program defines an event that sends notifications if a process fails to receive RAM resources for more than 150 milliseconds within a one-second time interval. If you name the file, say, psi_example.c, you can build it easily by typing make psi_example, assuming you have the build tools in place.
Listing 6
psi_example.c
01 #include <errno.h>
02 #include <fcntl.h>
03 #include <stdio.h>
04 #include <poll.h>
05 #include <string.h>
06 #include <unistd.h>
07 /*
08  * Monitor memory partial stall with 1s tracking
09  * window size and 150ms threshold.
10  */
11 int main() {
12   const char trig[] = "some 150000 1000000";
13   struct pollfd fds;
14   int n;
15   fds.fd = open("/proc/pressure/memory",
16                  O_RDWR | O_NONBLOCK);
17   if (fds.fd < 0) {
18     printf("/proc/pressure/memory open error: %s\n",
19             strerror(errno));
20     return 1;
21   }
22   fds.events = POLLPRI;
23   if (write(fds.fd, trig, strlen(trig) + 1) < 0) {
24     printf("/proc/pressure/memory write error: %s\n",
25             strerror(errno));
26     return 1;
27   }
28   printf("waiting for events...\n");
29   while (1) {
30     n = poll(&fds, 1, -1);
31     if (n < 0) {
32       printf("poll error: %s\n", strerror(errno));
33       return 1;
34     }
35     if (fds.revents & POLLERR) {
36       printf("got POLLERR, event source is gone\n");
37       return 0;
38     }
39     if (fds.revents & POLLPRI) {
40       printf("event triggered!\n");
41     } else {
42       printf("unknown event received: 0x%x\n",
43               fds.revents);
44       return 1;
45     }
46   }
47   return 0;
48 }
Conclusions
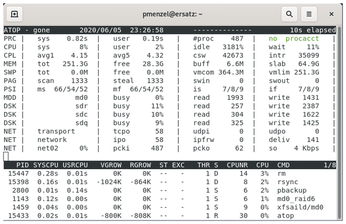
PSIs compressed to only one or two lines inform the admin about resource bottlenecks [5]. The file-based interface makes it easy to integrate scripts and helps to build monitoring systems. Even external system monitoring tools such as Atop already integrate PSI (Figure 2).
Thanks to the integration of PSI in Cgroups, admins receive this information globally for the entire system and in a granular form. PSI provides admins with a powerful alternative to the load average for a better overview of resource bottlenecks.
Infos
- "Solving the Mystery": http://www.brendangregg.com/blog/2017-08-08/linux-load-averages.html
- PSI: https://facebookmicrosites.github.io/psi/
- Weiner's project presentation: https://lkml.org/lkml/2018/8/28/816
- PSI documentation: https://www.kernel.org/doc/html/latest/accounting/psi.html
- Examples of using PSI: https://unixism.net/2019/08/linux-pressure-stall-information-psi-by-example/
« Previous 1 2
Buy this article as PDF
(incl. VAT)
Buy Linux Magazine
US / Canada
UK / Australia
Subscribe to our Linux Newsletters
Find Linux and Open Source Jobs
Subscribe to our ADMIN Newsletters
Support Our Work
Linux Magazine content is made possible with support from readers like you. Please consider contributing when you’ve found an article to be beneficial.

News
-
Linux Servers Targeted by Akira Ransomware
A group of bad actors who have already extorted $42 million have their sights set on the Linux platform.
-
TUXEDO Computers Unveils Linux Laptop Featuring AMD Ryzen CPU
This latest release is the first laptop to include the new CPU from Ryzen and Linux preinstalled.
-
XZ Gets the All-Clear
The back door xz vulnerability has been officially reverted for Fedora 40 and versions 38 and 39 were never affected.
-
Canonical Collaborates with Qualcomm on New Venture
This new joint effort is geared toward bringing Ubuntu and Ubuntu Core to Qualcomm-powered devices.
-
Kodi 21.0 Open-Source Entertainment Hub Released
After a year of development, the award-winning Kodi cross-platform, media center software is now available with many new additions and improvements.
-
Linux Usage Increases in Two Key Areas
If market share is your thing, you'll be happy to know that Linux is on the rise in two areas that, if they keep climbing, could have serious meaning for Linux's future.
-
Vulnerability Discovered in xz Libraries
An urgent alert for Fedora 40 has been posted and users should pay attention.
-
Canonical Bumps LTS Support to 12 years
If you're worried that your Ubuntu LTS release won't be supported long enough to last, Canonical has a surprise for you in the form of 12 years of security coverage.
-
Fedora 40 Beta Released Soon
With the official release of Fedora 40 coming in April, it's almost time to download the beta and see what's new.
-
New Pentesting Distribution to Compete with Kali Linux
SnoopGod is now available for your testing needs