Getting started with the ELK Stack monitoring solution
Log Management
Filebeat attends to tasks related to log collection. Filebeat has some built-in parsers for commonly recognized logfile types, such as syslog, Nginx logs, and a few more.
The filebeat.yml file in Listing 10 shows two modules for handling system logs and Nginx logs. Both modules are built into the base Filebeat application and provide functionality to break the lines of the log into events that can be sent directly to Elasticsearch.
Listing 10
filebeat.yml
01 filebeat.modules:
02 - module: nginx
03   access:
04     var.paths: ["/var/log/nginx/access.log"]
05   error:
06     var.paths: ["/var/log/nginx/error.log"]
07 - module: system
08   syslog:
09     var.paths: ["/var/log/messages"]
10   auth:
11     var.paths: ["/var/log/secure"]
12 setup.kibana.host: "http://172.22.222.222:5601"
13 setup.dashboards.enabled: true
14 output.elasticsearch.hosts: ["172.22.222.222:9200"]
Listing 11 shows an event stored to Elasticsearch by Filebeat (with some insignificant parts removed for brevity). This sample event originates from a log entry like the following:
Sep 28 13:49:07 slave0 sudo[17900]: vagrant : TTY=pts/1 ;PWD=/home/vagrant ; USER=root ;COMMAND=/bin/vim/etc/filebeat/filebeat.yml
Listing 11
Store in Elasticsearch via Filebeat
01 $ curl -s "localhost:9200/filebeat-7.8.0-2020.09.28/_search?pretty=true&sort=@timestamp&size=1"
02
03 "_source" : {
04   "agent" : {
05     "hostname" : "slave0",
06     "type" : "filebeat"
07   },
08   "process" : {
09     "name" : "sudo",
10     "pid" : 17900
11   },
12   "log" : {
13     "file" : {
14       "path" : "/var/log/secure"
15     }
16   },
17   "fileset" : {
18     "name" : "auth"
19   },
20   "input" : {
21     "type" : "log"
22   },
23   "@timestamp" : "2020-09-28T13:49:07.000Z",
24   "system" : {
25     "auth" : {
26       "sudo" : {
27         "tty" : "pts/1",
28         "pwd" : "/home/vagrant",
29         "user" : "root",
30         "command" : "/bin/vim /etc/filebeat/filebeat.yml"
31       }
32     }
33   },
34   "related" : {
35     "user" : [
36       "vagrant"
37     ]
38   },
39   "service" : {
40     "type" : "system"
41   },
42   "host" : {
43     "hostname" : "slave0"
44   }
45 }
Keep in mind that Filebeat is designed to work with structured and known log types. If you aim to track unspecified logs, you need to use Logstash.
Logstash
In order to track and ship unstructured logs, you have to use a simple log module, and its output should mainly go through Logstash, unless you are only interested in the timestamp and message fields. You need Logstash to act as an aggregator for multiple logging pipelines.
Despite its name, Logstash does not stash any logs. It receives log data and processes it with filters (Figure 2). In this case, processing means transforming, by removing unnecessary elements or splitting objects into terms that can serve as JSON objects and be sent to a tool like Elasticsearch. When the logs are processed, you have to define the output: The output could go to Elasticsearch, a file, a monitoring tool like StatsD, or one of several other output options.

The logstash.yml file shown in Listing 12 only presents non-default values. You need to define the data and specify where logstash will keep temporary data.
Listing 12
Exceptions from logstash.yml
01 $ cat files/logstash.yml | grep -vP '^#'
02 path.data: /var/lib/logstash
03 pipeline.id: main
04 path.config: "/etc/logstash/conf.d/pipeline.conf"
05 http.host: 0.0.0.0
Pipelines are sets of input/filter/output rules. You can define multiple pipelines and list them in file pipelines.yml. When you have a single pipeline, you can specify it directly in the main config. The pipeline.conf file (Listing 13) lets you specify the input, filter, and output for the pipeline. The input options include reading from a file, listening on port 514 for syslog messages, reading from a Redis server, and processing events sent by beats. A pipeline can also receive input from services such as the Cloudwatch monitoring tool or the RabbitMQ message broker.
Listing 13
pipeline.conf
01 input {
02     beats {
03         port => 5044
04     }
05 }
06 filter {
07     if [fileset][module] == "system" {
08         if [fileset][name] == "auth" {
09 (...)
10   }
11         else if [fileset][name] == "syslog" {
12             grok {
13                 match => {
14        "message" => ["%{SYSLOGTIMESTAMP:[system][syslog][timestamp]} %{SYSLOGHOST:[system][syslog][hostname]} \
15                     %{DATA:[system][syslog][program]}(?:\[%{POSINT:[system][syslog][pid]}\])?: \
16                     %{GREEDYMULTILINE:[system][syslog][message]}"]
17                 }
18                 pattern_definitions => {
19                     "GREEDYMULTILINE" => "(.|\n)*"
20                 }
21             }
22         }
23     }
24     else if [fileset][module] == "nginx" {
25        (...)
26     }
27 }
28 output {
29     elasticsearch {
30         hosts => localhost
31         manage_template => false
32         index => "logstash-%{[@metadata][beat]}-%{[@metadata][version]}-%{+YYYY.MM.dd}"
33     }
34 }
Filters transform data in various ways to prepare it for later storage or processing. Some popular filter options include:
- grok filter – transforms unstructured lines into structured data.
- csv – converts csv content into a list of elements.
- geoip – assigns geographic coordinates to a given IP addresses.
The output settings define where the data goes after filtering, which might be to Elasticsearch, email, a local file, or a database.
As you can see in Listing 13, the sample pipeline starts with waiting for beat input on port 5044. The most complex part of Listing 13 is the filter. In this case, the filter will parse syslog, audit.log, Nginx, and error logs, and each log has different syntax.
Most filters are self-explanatory, but grok [3] requires a comment: it is a plugin that modifies information in one format and immerses it in another (JSON, in this case). To speed up the process, you can use a built in pattern, like IPORHOST or DATA. There are already hundreds of grok patterns available, but you can define your own, like the GREEDYMULTILINE pattern in Listing 13.
A pattern in grok has the format %{SYNTAX:SEMANTIC}, where SYNTAX is a regex (or another SYNTAX with regex) and SEMANTIC is a human-acceptable name that you will want to bind to the matched expression. When transformation is completed, you can output the data, in this case to Elasticsearch.
Kibana and Logtrail
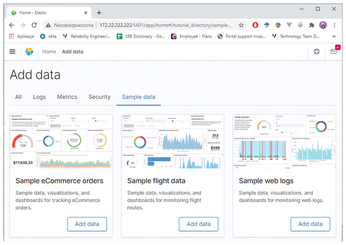
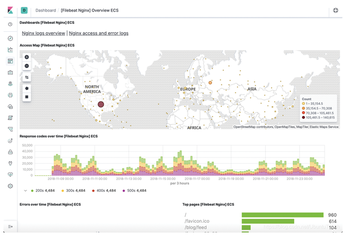
Kibana is a visualization dashboard system that helps you view and analyze data obtained through other ELK components (Figure 3 and 4). Kibana supports hundreds of dashboards, allowing you to visualize different kinds of data in many useful ways. A system of plugins makes it easy to configure Kibana to display different kinds of data.


In this example, I'll show you how to set up Kibana to use Logtrail, a popular plugin for searching and visualizing logfiles.
You have to call kibana-plugin to install Logtrail (Listing 14). (Of course, you also could have installed it with Ansible.)
Listing 14
Installing Logtrail
01 [root@ELK ~]# cd /usr/share/kibana/bin/
02 [root@ELK bin]# ./kibana-plugin --allow-root install \
03 https://github.com/sivasamyk/logtrail/releases/download/v0.1.31/logtrail-7.8.0-0.1.31.zip
The Logtrail config file (Listing 15) lets you define which index/indices it should take data from, as well as some display settings and mappings for essential fields such as the timestamp, hostname, and message. You can also add more fields and define custom message formats.
Listing 15
logtrail.json
01 {
02 "index_patterns" : [
03   {
04     "es": {
05       "default_index": "logstash-*"
06     },
07     "tail_interval_in_seconds": 10,
08     "display_timestamp_format": "MMM DD HH:mm:ss",
09     "fields" : {
10       "mapping" : {
11           "timestamp" : "@timestamp",
12           "hostname" : "agent.hostname",
13           "message": "message"
14       }
15     },
16     "color_mapping" : {
17       "field": "log.file.path",
18       "mapping" : {
19         "/var/log/nginx/access.log": "#00ff00",
20         "/var/log/messages": "#0000ff",
21         "/var/log/secure": "#ff0000"
22       }
23     }
24   }
25 ]
26 }
« Previous 1 2 3 Next »
Buy this article as PDF
(incl. VAT)
Buy Linux Magazine
Subscribe to our Linux Newsletters
Find Linux and Open Source Jobs
Subscribe to our ADMIN Newsletters
Support Our Work
Linux Magazine content is made possible with support from readers like you. Please consider contributing when you’ve found an article to be beneficial.

News
-
TUXEDO Computers Unveils Linux Laptop Featuring AMD Ryzen CPU
This latest release is the first laptop to include the new CPU from Ryzen and Linux preinstalled.
-
XZ Gets the All-Clear
The back door xz vulnerability has been officially reverted for Fedora 40 and versions 38 and 39 were never affected.
-
Canonical Collaborates with Qualcomm on New Venture
This new joint effort is geared toward bringing Ubuntu and Ubuntu Core to Qualcomm-powered devices.
-
Kodi 21.0 Open-Source Entertainment Hub Released
After a year of development, the award-winning Kodi cross-platform, media center software is now available with many new additions and improvements.
-
Linux Usage Increases in Two Key Areas
If market share is your thing, you'll be happy to know that Linux is on the rise in two areas that, if they keep climbing, could have serious meaning for Linux's future.
-
Vulnerability Discovered in xz Libraries
An urgent alert for Fedora 40 has been posted and users should pay attention.
-
Canonical Bumps LTS Support to 12 years
If you're worried that your Ubuntu LTS release won't be supported long enough to last, Canonical has a surprise for you in the form of 12 years of security coverage.
-
Fedora 40 Beta Released Soon
With the official release of Fedora 40 coming in April, it's almost time to download the beta and see what's new.
-
New Pentesting Distribution to Compete with Kali Linux
SnoopGod is now available for your testing needs
-
Juno Computers Launches Another Linux Laptop
If you're looking for a powerhouse laptop that runs Ubuntu, the Juno Computers Neptune 17 v6 should be on your radar.

