All-purpose admin tool
Secondary Nmon Applications
Several applications exist for postprocesing nmon data. The first is called nmon_analyser [18]. The tool developed by IBM is an Excel spreadsheet that processes .nom files and outputs the results in tabs in a new spreadsheet. I won't cover all of the details in this article, but the tool is very easy to use. Just click on the Analyse nmon data button in the first spreadsheet tab, and it will prompt you for the input file.
The output spreadsheet contains plots, presented with the time series data, and metadata, presented as tabular data. I won't cover all of the tabs in the output spreadsheet because there can be many, but I will show two plots to give you an idea of what it produces.
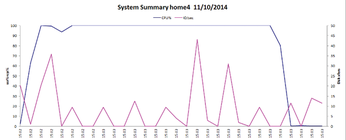
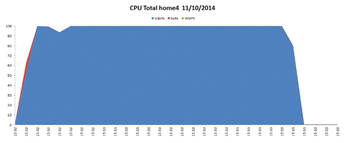
The first chart in the spreadsheet is titled System Summary (Figure 10), and it presents two pieces of data. The first is the sum of the user and system CPU percentages, and the second is I/O transfers per second (roughly IOPS). Clicking through the spreadsheet tabs displays other data analyses, but the other plot I want to share shows percent CPU usage for user, system, and idle times (Figure 11).
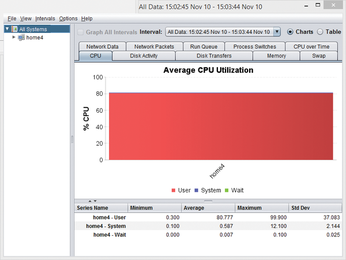
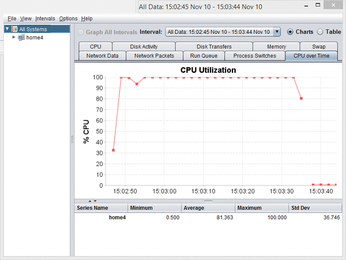
A Java-based tool named NMONVisualizer [19] can take nmon data from one or more CSV files and create plots. To use it, you just start the application and open the .nmon file; it then processes the data and creates a number of plots. The screen shot in Figure 12 shows a CPU chart of percent CPU usage by user, system, and wait time over the interval examined. The chart is only showing 80% CPU utilization because nmon continued to collect data after FT had finished running. All of the other tabs in Figure 12 contain other charts. For example, Figure 13 shows CPU usage for the system in the CPU over Time tab.
Other secondary applications are available as well. If you use Python, you can analyze nmon output data via pyNmonAnalyzer [20]. The tool massages the nmon CSV data to make it more amenable to spreadsheets and creates two HTML-based reports.
One report creates static graphs, and the other has interactive graphs powered by dygraphs [21]. Unfortunately, I couldn't get pyNmonAnalyzer to work on my CentOS 6.6 box, even with the Software Collection installed; perhaps you will have better luck.
The nmon2rrd [22] tool converts the nmon CSV file to a website of graphs. I tried the tool, but it appears to work with the AIX version of nmon only. One last tool that might be useful is called nmon2web [23], which creates web pages from nmon data. I haven't tried this application, but it sounds pretty interesting.
Summary
I'm a big proponent of command-line tools to help debug misbehaving nodes, because many times I only have command-line access to the node. In the previous two articles, I covered two classes of tools I use: top-like tools and stat-like tools.
In my experience, the most common user issue is performance – Why isn't my application running? Why isn't my application running fast? Why isn't my application running as fast as it did yesterday? Therefore, I need tools to help me examine node performance, so I need a combination of top- and stat-like tools, which is why I like using nmon.
Nmon can be used as a top-like tool to watch what is happening on the system, but you can also use it to capture system information that can be used to understand what the system is doing. The many nmon options monitor what is happening on the system, and some even produce ASCII charts. It's a great way to get a quick visual impression of what is happening in the system.
Nmon can also capture a great deal of information from the system and produce CSV files for postprocessing. However, the results are typically not easy to postprocess, so you need to use one of the tools mentioned in this article to visualize the data.
Give nmon a chance. I think you will like what it can do for you.
Infos
- nmon: http://nmon.sourceforge.net/pmwiki.php
- CSV file: http://en.wikipedia.org/wiki/Comma-separated_values
- atop: http://www.atoptool.nl/
- htop: http://hisham.hm/htop/
- vmstat: http://en.wikipedia.org/wiki/Vmstat
- Dstat: http://dag.wiee.rs/home-made/dstat/
- mpstat: http://en.wikipedia.org/wiki/Mpstat
- "Stat-like Command-Line Tools for Admins" by Jeff Layton, Linux Pro Magazine, issue 169, December 2014, pg. 36, http://www.linuxpromagazine.com/Online/Features/Stat-like-Tools-for-Admins
- Curses: http://en.wikipedia.org/wiki/Curses_(programming_library)
- nmon binaries: http://nmon.sourceforge.net/pmwiki.php?n=Site.Download
- NAS Parallel Benchmarks: http://www.nas.nasa.gov/publications/npb.html
- Slabs: http://en.wikipedia.org/wiki/Slab_allocation
- "Oracle, Memory, and Linux" by Christo Kutrovsky: http://www.slideshare.net/khailey/christo-kutrovsky-oracle-memory-linux
- Active vs. inactive memory: http://stackoverflow.com/questions/18529723/what-is-active-memory-and-inactive-memory
- Mapped memory: http://www.makelinux.net/alp/037
- Memory management: http://www.tldp.org/LDP/tlk/mm/memory.html
- Sysstat: http://sebastien.godard.pagesperso-orange.fr/
- nmon_analyser: http://www.ibm.com/developerworks/aix/library/au-nmon_analyser/
- NMONVisualizer: http://nmonvisualizer.github.io/nmonvisualizer/
- pyNmonAnalyzer: https://github.com/madmaze/pyNmonAnalyzer
- dygraphs: http://dygraphs.com/
- nmon2rrd: https://www.ibm.com/developerworks/community/wikis/home?lang=en#!/wiki/Power%20Systems/page/nmon2rrd
- nmon2web: http://ca.astound.net/~baspence/AIXtip/nmon2web.htm
« Previous 1 2
Buy this article as PDF
(incl. VAT)
Buy Linux Magazine
US / Canada
UK / Australia
Subscribe to our Linux Newsletters
Find Linux and Open Source Jobs
Subscribe to our ADMIN Newsletters
Support Our Work
Linux Magazine content is made possible with support from readers like you. Please consider contributing when you’ve found an article to be beneficial.

News
-
Canonical Releases Ubuntu 24.04
After a brief pause because of the XZ vulnerability, Ubuntu 24.04 is now available for install.
-
Linux Servers Targeted by Akira Ransomware
A group of bad actors who have already extorted $42 million have their sights set on the Linux platform.
-
TUXEDO Computers Unveils Linux Laptop Featuring AMD Ryzen CPU
This latest release is the first laptop to include the new CPU from Ryzen and Linux preinstalled.
-
XZ Gets the All-Clear
The back door xz vulnerability has been officially reverted for Fedora 40 and versions 38 and 39 were never affected.
-
Canonical Collaborates with Qualcomm on New Venture
This new joint effort is geared toward bringing Ubuntu and Ubuntu Core to Qualcomm-powered devices.
-
Kodi 21.0 Open-Source Entertainment Hub Released
After a year of development, the award-winning Kodi cross-platform, media center software is now available with many new additions and improvements.
-
Linux Usage Increases in Two Key Areas
If market share is your thing, you'll be happy to know that Linux is on the rise in two areas that, if they keep climbing, could have serious meaning for Linux's future.
-
Vulnerability Discovered in xz Libraries
An urgent alert for Fedora 40 has been posted and users should pay attention.
-
Canonical Bumps LTS Support to 12 years
If you're worried that your Ubuntu LTS release won't be supported long enough to last, Canonical has a surprise for you in the form of 12 years of security coverage.
-
Fedora 40 Beta Released Soon
With the official release of Fedora 40 coming in April, it's almost time to download the beta and see what's new.