Detecting spam users automatically with a neural network
Genuine Configuration
Although the optimization process aims for a good result with use of the training data, it is possible that the network could, in a sense, learn the training data by heart instead of generalizing and developing a common method. This effect is called overfitting [6]. To test whether the network does generalize, you have to split the data set in advance into training data and validation data. Use the training data for optimizing parameters, determine the accuracy via validation data still unknown to the network, then compare the different network configurations.
In addition to training and validation data, you'll also need to set aside some data for testing the neural network. Training, validation, and test data is typically distributed at an 80:10:10 ratio.
The network here consists of a layer of 30 neurons with the linear activation function and four Relu layers with 30 neurons each. Adam optimizes with a 0.00001 learning rate. After 500 epochs, the activation function achieves an accuracy of 92.6 percent with the validation data and still manages 91.9 percent with test data. The training lasted around 30 minutes on a MacBook Pro.
You can normalize the data in advance if you want to produce a better result. To normalize, begin by weighting the values to the average by subtracting the arithmetic mean. You then bring the data to the interval [-1, 1] by dividing by the standard deviation. It is important to determine the arithmetic mean and standard deviation only with the training data and to reuse these values for the validation, testing, and production data.
TensorFlow
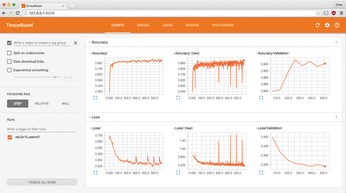
The TensorFlow library implements the neural network. TensorFlow comes with TensorBoard, a web app that displays statistics from TensorFlow and processes them graphically (Figure 7). TensorBoard helps with optimizing the network structure and is very well suited for monitoring the learning process and comparing different configurations. TFLearn also uses TensorFlow and provides easier-to-use functions for neural networks.
See the instructions at the TensorFlow project website for information on how to install TensorFlow [7]. Python package manager pip then installs TFLearn on the hard drive. You will need at least version 0.2.2. We installed TFLearn via Git, as described at the project website [8]. You will also need the numpy, sklearn, scipy, and pillow packages.
Listing 2 shows excerpts from the dnn.py script, which trains and evaluates neural networks (Listing 3) and is used for classification (see Listing 4).
Listing 2
train Function from dnn.py
Listing 3
evaluate Function from dnn.py
Listing 4
predict Function from dnn.py
Listing 2 demonstrates how the developer can train a network with TFLearn. The script first loads the input data from the CSV file before splitting and normalizing the data. The script then saves the mean value and standard deviation of the training data to apply them to the production data later on. The best_checkpoint_path parameter (line 17) instructs TFLearn to save the state of the network each time as soon as the script achieves higher accuracy with the validation data during training. The script trains the network across epochs with n_epoch via the model.fit() method from the TFLearn library.
Listing 3 deals with evaluation of the network. First, the code re-imports the CSV file with the input data. The script divides the data equally with each execution according to the random number generator's fixed seed. It then retrieves the mean value and the standard deviation, normalizing the test data. To finish, it evaluates the network status with the best accuracy and determines the hit rate of the test data set with model.evaluate().
The code in Listing 4 allows the network to classify the data. It also reads the data to be classified as a CSV file, normalizes it, loads the network status, and classifies data sets with model.predict(). The function outputs the probabilities for each class per data set.
Experiments
The experiments.py file determines the structure and configuration of the individual networks (Listing 5). An experiment is a function. It returns a tuple consisting of input data, network, optimization methods, batch size, and number of epochs. Here, input is a tuple including the CSV file name, the list of columns with properties, and the column that specifies the class.
Listing 5
experiments.py
The methods tflearn.input_data(), tflearn.batch_normalization(), and tflearn.fully_connected() define the network's layers. The developer individually assigns each layer a size and an activation function. The input layer receives the properties, with their size depending on their number. There should be a batch normalization layer ahead of each fully connected layer. The softmax type, with the number of classes as its size, is recommended for the last layer.
The batch size reveals how many data sets the optimization method processes at once during an iteration. The higher the figure, the more smoothly the loss and accuracy graphs are plotted in TensorBoard and the faster TensorFlow trains the network, although a higher batch size also requires more resources. A figure between 128 and 1024 is a good reference value.
The epochs variable in the script represents the number of epochs, so it specifies how frequently the neural network manages to learn the entire training set. This network mostly converged after 500 iterations, so it is worth using a higher value in this instance. You can manually cancel the training as soon as the loss no longer changes.
Call up:
python dnn.py train experiment
to train a network, where experiment is the name of a function that you created earlier in the experiments.py file. The current loss and the accuracy of both the training and the validation data appear directly in the terminal during training. TensorBoard represents the values as a graph. To start TensorBoard, use:
tensorboard -logdir=/tmp/tflearn_logs/
Usually you call the web interface in the browser with http://127.0.0.1:6006. The plotted graphs for accuracy and loss are hidden behind the Events entry. You can select the experiments under the Runs section. The data usually updates automatically every 120 seconds; you can also update manually on request by clicking the button at the top right.
If you have found a good configuration and feel satisfied with the accuracy of the network, you can perform a check by entering
python dnn.py evaluate experiment
to establish how well the network detects still-unknown test data. You must also store new data sets in a CSV file to classify them and call them up with the command:
python dnn.py predict experiment Input
The network classifies the data and outputs the probabilities for the corresponding classes line by line. In the example here, the first value for each line describes the probability of the user having good intentions, and the second provides the same for spammer suspects.
« Previous 1 2 3 4 Next »
Buy this article as PDF
(incl. VAT)
Buy Linux Magazine
US / Canada
UK / Australia
Subscribe to our Linux Newsletters
Find Linux and Open Source Jobs
Subscribe to our ADMIN Newsletters
Support Our Work
Linux Magazine content is made possible with support from readers like you. Please consider contributing when you’ve found an article to be beneficial.

News
-
TUXEDO Computers Unveils Linux Laptop Featuring AMD Ryzen CPU
This latest release is the first laptop to include the new CPU from Ryzen and Linux preinstalled.
-
XZ Gets the All-Clear
The back door xz vulnerability has been officially reverted for Fedora 40 and versions 38 and 39 were never affected.
-
Canonical Collaborates with Qualcomm on New Venture
This new joint effort is geared toward bringing Ubuntu and Ubuntu Core to Qualcomm-powered devices.
-
Kodi 21.0 Open-Source Entertainment Hub Released
After a year of development, the award-winning Kodi cross-platform, media center software is now available with many new additions and improvements.
-
Linux Usage Increases in Two Key Areas
If market share is your thing, you'll be happy to know that Linux is on the rise in two areas that, if they keep climbing, could have serious meaning for Linux's future.
-
Vulnerability Discovered in xz Libraries
An urgent alert for Fedora 40 has been posted and users should pay attention.
-
Canonical Bumps LTS Support to 12 years
If you're worried that your Ubuntu LTS release won't be supported long enough to last, Canonical has a surprise for you in the form of 12 years of security coverage.
-
Fedora 40 Beta Released Soon
With the official release of Fedora 40 coming in April, it's almost time to download the beta and see what's new.
-
New Pentesting Distribution to Compete with Kali Linux
SnoopGod is now available for your testing needs
-
Juno Computers Launches Another Linux Laptop
If you're looking for a powerhouse laptop that runs Ubuntu, the Juno Computers Neptune 17 v6 should be on your radar.