Process management in a gamer outfit

System Under Control

Article from Issue 267/2023
Author(s):

Btop++ combines a high level of convenience with blistering speed in system monitoring and process management.

System monitoring and process management are not necessarily popular, but they are indispensable tasks when you work with computers, whether on the desktop or on servers. Tools that help us do this need to show us as much information as possible in the space available. Terminal-based tools are particularly practical because they can be used both on desktops with a graphical interface and on remote computers.

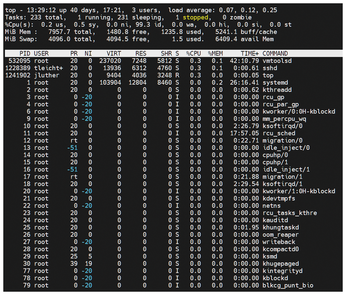
At the command line, top ("table of processes") is the classic application in this category. First released in 1984 for BSD 4.1, it has also been available on Linux since 1991. Top displays a continuously updated list of all processes and also provides information about the processor load, memory consumption, the number of tasks, and other data (Figure 1). What the tool doesn't offer is clear-cut visual representation of the values.

Figure 1: Top is the great grandmother of process management on Linux. Its resource usage is minimal, but the values are difficult to understand at a glance.

In 2004, top was combined with the character-oriented ncurses user interface and has since been in residence on many a Linux machine in the form of htop. The display is clearer than with top alone, not least thanks to a configurable colored interface (Figure 2).

Figure 2: Htop made the way information is visualized clearer (not least due to the colored display), but controlling the app is still less than intuitive.

bashtop, bpytop, btop++

Developer Jakob P. Liljenberg, aka aristocratos, had a different graphical implementation in mind. He named it bashtop [1], and it is a Bash script (Figure 3), as you might guess from the name. To update the displayed values faster, Liljenberg then rewrote the tool in Python and published it as bpytop [2].

Figure 3: The bashtop developer chose a catchy visual presentation of the displayed values; this hardly changed in the successors, bpytop and btop++.

But even this incarnation was not yet sufficient for his needs, which prompted a rewrite in C++, dubbed btop++ [3]. Fans of the flexible process manager joked on the Reddit platform that the only thing missing now was a port to Rust, which could then culminate in a conversion to assembler. The name of the fictitious assembler tool is left to your imagination.

Btop++ takes us to the topic of this article. Btop++ is visually little different from its predecessors in Bash and Python, but it noticeably achieves the objective of accelerating value updates. On top of this, the C++ program has lower CPU and RAM requirements than its predecessors. Btop++ is not only available for Linux, but also for FreeBSD and macOS. A Windows port named btop4win is already done and will be released in the near future. Btop already works on the Windows Subsystem for Linux (WSL).

Version 1.2.8, released in June 2022, is already included in the package sources of many distributions, while others have btop++ 1.2.7. If the distribution you are using only offers an older version, you can easily install btop using the package manager or compile it yourself [4]. Version 1.2.9, which was the latest version when this issue went to press, offers a number of bug fixes, improvements in detail, and new themes, compared to its predecessors (Figure 4).

Figure 4: The btop standard interface uses a black background and darker hues, but you can easily change this by selecting a different theme.

The requirements for the best possible display of btop are a terminal with 24-bit true color [5], UTF-8 encoding, and a font that supports Braille. You also need a terminal with at least 80x24 lines. If the characters are displayed differently from the screenshots [6] on GitHub, you can find out why on the btop++ GitHub page under "Notice (Text rendering issues)" [7].

What btop Can Do

Btop displays real-time statistical values for the CPU, memory, storage media, network, and processes, updating them every two seconds by default. The values can be manipulated using the keyboard and mouse. All buttons with a character highlighted in red, in the default view, respond to mouse clicks, and you can scroll through the process table using the mouse wheel. Using the keyboard tends to be more practical all told and is definitely faster. Another editing mode that can be enabled in the settings is Vim mode. If you are a Vim user, you can use your muscle memory to navigate the process list with the H, J, K, and L keys.

The interface separates the different sections visually; each uses a different set of colors on a standard black background. The upper area is occupied by the CPU. On the right, btop++ shows the individual cores with the respective loads as percentages and the temperature for each core. Above this you can see the battery charging status, if the system has a battery. On the left, a real-time graph visualizes the workload for the last few minutes.

Below this, btop++ splits the view into two panes. Center left you can see the data for the RAM and storage media. The display for the RAM shows you the total memory, along with the values for in-use, cached, and free memory. To the right, small graphs indicate the storage media occupancy. Internal and external HDDs or SSDs appear here, along with the EFI boot partition if available. The area below this is for the network. Like for the CPU, btop++ shows the numeric values on the right, while a graph on the left visualizes the throughput for outgoing and incoming network traffic.

The right half of the display next to these two areas is taken up by the process list with a field at the top showing the details of the currently selected process. Below this there is a list of running processes and other information.

Well Prepared

After completing the install, the first launch, and finding your way around, you may want to press Esc or M to access the configuration. You will find the Options, Help, and Quit items in the menu that now opens. The settings in Options are distributed across the general, cpu, mem, net, and proc tabs.

In the general tab, you can select your favorite theme from a list of about two dozen themes at the top. You can also define the background and how the display boxes are positioned on it. Three options let you change the appearance of the graphs. If so desired, you can select a different display format for each box individually. You can also turn off the indicators for the battery here if you are working on a desktop. The other tabs let you manipulate how the components are positioned and the values displayed (Figure 5). If you prefer to handle the configuration in a text file, you will find it in ~/.config/btop/ along with the logfiles and the individual themes.

Figure 5: You can either configure btop in the graphical menu or edit it in the configuration file in your home directory directly.

The Help menu lists the keyboard commands for controlling btop. The most important control options and short explanations are listed in Table 1.

Table 1

Keyboard Shortcuts

Key(s)

Function

Esc/M/Shift+M

Displays the main menu

F1/H/Shift+H

Displays the keyboard layout

F2/O/Shift+O

Displays the Options submenu

Ctrl+C/Q/Shift+Q

Quits the application

+/A/Shift+A

Extends the update interval by 100ms

-/S/Shift+S

Shortens the update interval by 100ms

Up arrow/Down arrow

Moves the cursor through the process list

Enter key

Shows details for the selected process

Home/End

Jumps to the beginning/end of the process list

E

Switches to the tree view of the process list

R

Rotates the order of the process list

F

Enter a string to filter processes

C

Removes active filters

1

Shows/hides the CPU box

2

Shows/hides the RAM and HDD box

3

Shows/hides the Network box

4

Shows/hides the process list

Buy this article as PDF

Express-Checkout as PDF
Price $2.95
(incl. VAT)

Buy Linux Magazine

SINGLE ISSUES
 
SUBSCRIPTIONS
 
TABLET & SMARTPHONE APPS
Get it on Google Play

US / Canada

Get it on Google Play

UK / Australia

Related content

  • Bpytop

    Linux users have many options for monitoring system resources, but bpytop, a new Python port of bashtop, more than stands out from the crowd.

  • Introduction

    This month in Linux Voice.

  • Real-Time Monitoring Tools

    The Top system monitor is a useful aid for identifying system bottlenecks, and Htop, Atop, and Glances extend its possibilities.

  • inxi-gui

    Inxi gives users a comprehensive inventory of their system hardware – but only at the command line. Inxi-gui, a graphical front end, makes things a little more convenient.

  • Compromising WordPress

    WordPress is an incredibly popular tool for building websites, and don't think the attackers haven't noticed. We'll show you what to watch for.

comments powered by Disqus
Subscribe to our Linux Newsletters
Find Linux and Open Source Jobs
Subscribe to our ADMIN Newsletters

Support Our Work

Linux Magazine content is made possible with support from readers like you. Please consider contributing when you’ve found an article to be beneficial.

Learn More

News