Troubleshooting with strace
Scenario 3: Diagnosing Permission Issues
A program sometimes has the correct files available but fails because of permission problems with those files. The Python script in Listing 3 attempts to open a file it doesn't have permission to read.
Listing 3
permission_issue.py
def main():
  try:
    with open('/tmp/no-permission.txt', 'r') as f:
      print("File opened successfully")
  except PermissionError as e:
    print(f"Failed to open file: {e}")
if __name__ == "__main__":
  main()
To try out this example, I'll create a file that the current user doesn't have permission to read:
$ sudo bash -c 'echo "Secret data" > /tmp/no-permission.txt'
$ sudo chown root /tmp/no-permission.txt
$ sudo chmod 600 /tmp/no-permission.txt
Now I'll run the script with strace:
$ strace python3 permission_issue.py
The output shows the following:
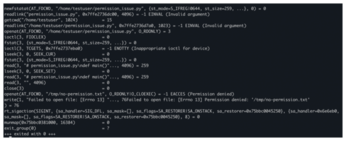
openat (AT_FDCWD, "/tmp/no-permission.txt", O_RDONLYI0_CLOEXEC) = -1 EACCES (Permission denied)
write(1, "Failed to open file: [Errno 13] ..., 76Failed to open file: [Errno 13] Permission denied: '/tmp/no-permission.txt') = 76
This output clearly shows that the kernel is denying access to the file due to insufficient permissions and the name of the file that caused the program to fail. Figure 3 shows a typical strace output for permission denied errors.
Scenario 4: Profiling System Call Overhead
Performance issues can often be traced to inefficient system call patterns. Strace can help identify these bottlenecks. Consider the Python script in Listing 4.
Listing 4
io_profile.py
import os
import subprocess
def main():
  # Create a test file
  subprocess.run("dd if=/dev/urandom of=/tmp/test_file bs=1M count=10",
    shell=True, stderr=subprocess.DEVNULL)
  print("Reading file byte-by-byte (inefficient)...")
  # Open the file
  fd = os.open("/tmp/test_file", os.O_RDONLY)
  bytes_read = 0
  # Read one byte at a time (very inefficient)
  for i in range(10000):
    buffer = os.read(fd, 1)
    if buffer:
      bytes_read += 1
  os.close(fd)
  print(f"Read {bytes_read} bytes")
if __name__ == "__main__":
  main()
To profile the program in Listing 4 for system call usage, I will use strace with the -c flag:
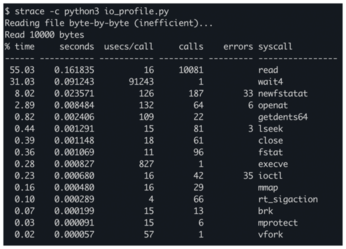
$ strace -c python3 io_profile.py
This command produces a summary table showing counts and timing for each system call. Table 1 shows the contents of the summary table.
Table 1
System Call Profiling Results
| % Time | Seconds | Usecs/Call | Calls | Errors | Syscall |
|---|---|---|---|---|---|
| 55.03 |
0.161835 |
16 |
10081 |
|
|
| 31.03 |
0.091243 |
91243 |
1 |
|
|
| 8.02 |
0.023571 |
126 |
187 |
33 |
|
| 2.89 |
0.008484 |
132 |
64 |
6 |
|
| 0.82 |
0.002406 |
109 |
22 |
|
|
| 0.44 |
0.001291 |
15 |
81 |
3 |
|
| 0.39 |
0.001148 |
18 |
61 |
|
|
| 0.36 |
0.001069 |
11 |
96 |
|
|
| 0.28 |
0.000827 |
827 |
1 |
|
This summary immediately highlights that the application is spending 55 percent of its system call time in read() operations, with 10,081 individual calls. This pattern of many small reads is highly inefficient compared to fewer, larger reads. Armed with this information, I can optimize the I/O strategy to improve performance dramatically. Figure 4 clearly show how system call profiling can identify performance bottlenecks.
Beyond strace: The Tracing Ecosystem
The strace utility is quite powerful, but it is just one part of a rich ecosystem of Linux tracing tools. For more advanced tracing, consider exploring:
ltrace– traces library calls, complementing strace's system call tracingperf– a powerful performance analysis tool with low overheadeBPF/BCC– allows for custom, efficient tracing programsSystemTap– provides a scripting language for creating custom tracing toolsftrace– the kernel's built-in tracing utility
Each of these tools offers different capabilities and performance characteristics, allowing you to choose the right approach for your specific needs.
« Previous 1 2 3 Next »
Buy this article as PDF
(incl. VAT)
Buy Linux Magazine
US / Canada
UK / Australia
Subscribe to our Linux Newsletters
Find Linux and Open Source Jobs
Subscribe to our ADMIN Newsletters
Support Our Work
Linux Magazine content is made possible with support from readers like you. Please consider contributing when you’ve found an article to be beneficial.

News
-
Two New Distros Adopt Enlightenment
MX Moksha and AV Linux 25 join ranks with Bodhi Linux and embrace the Enlightenment desktop.
-
Solus Linux 4.8 Removes Python 2
Solus Linux 4.8 has been released with the latest Linux kernel, updated desktops, and a key removal.
-
Zorin OS 18 Hits over a Million Downloads
If you doubt Linux isn't gaining popularity, you only have to look at Zorin OS's download numbers.
-
TUXEDO Computers Scraps Snapdragon X1E-Based Laptop
Due to issues with a Snapdragon CPU, TUXEDO Computers has cancelled its plans to release a laptop based on this elite hardware.
-
Debian Unleashes Debian Libre Live
Debian Libre Live keeps your machine free of proprietary software.
-
Valve Announces Pending Release of Steam Machine
Shout it to the heavens: Steam Machine, powered by Linux, is set to arrive in 2026.
-
Happy Birthday, ADMIN Magazine!
ADMIN is celebrating its 15th anniversary with issue #90.
-
Another Linux Malware Discovered
Russian hackers use Hyper-V to hide malware within Linux virtual machines.
-
TUXEDO Computers Announces a New InfinityBook
TUXEDO Computers is at it again with a new InfinityBook that will meet your professional and gaming needs.
-
SUSE Dives into the Agentic AI Pool
SUSE becomes the first open source company to adopt agentic AI with SUSE Enterprise Linux 16.