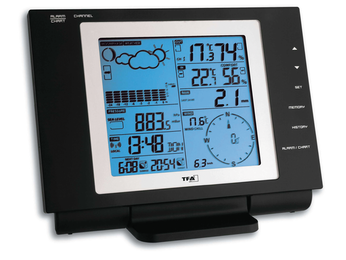
Access data from a weather station with the Raspberry Pi

Displaying Data Charts on Websites

Creating charts from the data and then embedding them in a web page can be done several ways. With Gnuplot, for example, a script could generate a graphic file, which is then embedded as an image in the website.

Google Charts provides a way to transmit the data to a web interface and returns an image file. You do not need graphics applications on your own web server in this case. I decided on a third option and used the Highcharts JavaScript library [6] to generate the charts.

Highcharts provides very attractive results. Although use for commercial purposes is a little expensive, private use is licensed free of charge by Highsoft Solutions AS under the "Creative Commons Attribution-NonCommercial 3.0 Unported" license.

Listing 3 creates a graph of a temperature profile over 24 hours. All it takes is to embed the two JavaScript libraries, jQuery and Highcharts. The chart itself is defined as a JavaScript function. The only special feature is the identification of the x-axis as date values and embedding the data values. A data value consists of the time and the temperature. The time data from the weather station previously had to be multiplied by 1,000 because JavaScript expects the values in milliseconds, and the measured data are stated in seconds.

Listing 3

Highcharts JS Graph


All Together Now

The ingredients described thus far make up the core of the application. What is still lacking is essentially regular data updates and interaction between the ingredients described above. A simple web application that reads data from the database and generates the corresponding chart is shown in Listing 4.

Listing 4

Generating the Chart as a Web App


The Sinatra web application is in lines 10 to 16. The call to inherit **:index embeds the data in the website. The website is then embedded in the script in line 21. Then, inherit replaces the code in line 32, <% = @data%>, with the contents of the @data variable. The result in the browser is shown in Figure 3.

Figure 3: A Highchart diagram in a Sinatra web application.

The only question that remains is how to collect the data regularly, which is handled by the previously mentioned cron job with an hourly call to the script in Listing 5.

Listing 5

Cron Job


This script is stored in the directory /etc/cron.hourly and tagged as executable using:

sudo chmod a+x crontab_pi

The load_data script, executed as a cron job, acquires the measured data, writes it to a CSV file, and uploads the file to the database.

Listing 4 shows how Sinatra can create a full-fledged web application with relatively little code. The rest of the process is hard work and involves acquiring the other readings from the weather station and cleaning up the code a little. In the end, the code might look like that shown in Figure 4.

Figure 4: The weather data in the finished application.

Extensible

I have published the preliminary results of my weather application as source code on GitHub.com [7]. To download and test the code with Git, call

git clone git://github.com/rheikvaneyck/rnexus.git

to create a local copy. You can update later with:

git pull

The code needs improvements in many places, but it provides insight into some ways to use your Raspberry Pi to build your own web applications.

The Author

Marcus Nasarek is a security professional and very much into shells and scripting languages.

Buy this article as PDF

Express-Checkout as PDF
Price $2.95
(incl. VAT)

Buy Linux Magazine

SINGLE ISSUES
 
SUBSCRIPTIONS
 
TABLET & SMARTPHONE APPS
Get it on Google Play

US / Canada

Get it on Google Play

UK / Australia

Related content

comments powered by Disqus