Evaluate systemd logs using journalctl
Finding the Time
If necessary, you can filter logs to show events at exact times. This is very helpful for computers that are not restarted often. Use the options --since and --until to narrow down the time window to the minute or second as required. You can also combine these options.
You can see an example of using one of the options on its own in the first line of Listing 5. The second line contains an example of using both. If you are specifying the time, it must be in the format YYYY-MM-DD HH:MM:SS. You can also use more general options such as --since yesterday, as shown in Listing 5.
Listing 5
Filtering Logs by Time
Filter by component
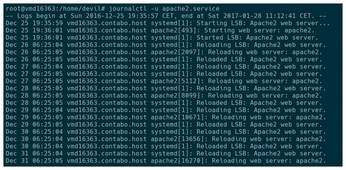
There are other filters you can use to search for specific events. This means you can detect messages relating to individual components. For example, if you are experiencing problems with your web server, use journalctl -u apache2.service to display only related events (Figure 3).
If you have an idea of where the error may be occurring within the web server, refine the filter further, as in the example query (Listing 6, line 1) of a suspect PHP module. To investigate specific processes, you can also filter by process, user or group ID.
Listing 6
Filtering by Component
First, look for the corresponding process ID. You can do this using the commands pidof or ps (Listing 6, lines 2 and 3). Next, query the corresponding process using the option _PID= (line 4). In Debian, you can find the user for the web server using the command id -u www-data (line 5), for instance to display all events since midnight (line 6). To display all possible filters, use man systemd.journal-fields.
You can also search for notifications from misbehaving applications. To do this, simply enter the relevant path. For applications installed via your package manager, these should be located in /usr/bin, for instance journalctl /usr/bin/amarok. For other apps, use which <name> to determine the exact path.
Including Kernel Messages
If your want to check for kernel messages, you can do so for the current session with journalctl -k. For information on previous sessions, use journalctl -k -b -n.
The option -p determines the priority of displayed messages. For instance, journalctl -p err shows error messages whereas journalctl -p crit displays critical messages. The log levels are the usual syslog log levels as documented in syslog(3) which you can find online, for instance on Wikipedia [4]. Both numeric and text values are accepted.
Buy Linux Magazine
US / Canada
UK / Australia