FOSSPicks
Command-line charting
ttyplot
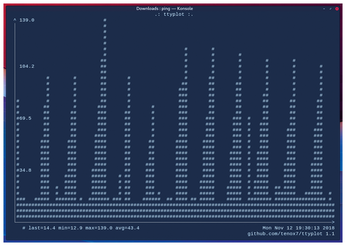
A month doesn't go by without the release of a new command-line monitoring tool. This isn't a bad thing, because the command line forces developers to think differently if they want to compete in an already saturated space. And this is what ttyplot does. It's not exactly a monitoring tool, at least not in the way you think of something like htop. Instead, it's more of a general tool like Gnuplot, albeit without the huge learning curve. That's because, while it does display data on a chart, it doesn't define what that data should be. Instead, it's intended to sit at the end of a command-line pipe, charting the numbers that arrive at its standard input, much like a multimeter might track incoming voltage. With just a few command-line options to handle two plots, the characters used to render charts, and hard and soft values, it's very easy to use. Mostly you just throw numbers at it and monitor the output.
One of the best examples comes from using ttyplot with the ping command. If you reduce its output to a single floating-point number, such as with
ping 8.8.8.8 | sed -u 's/^.*time=//g; s/ ms//g'
and then pipe this into ttyplot, you'll see a histogram being plotted in real time as the latency of the remote server changes. It's perfect for the average embattled sysop who still needs to monitor response time and availability, especially if you need to tweak the exact kind of statistics you want to track. And if you want to track more than one, simply use something like tmux to run as many instances as you need, in whatever configuration best suits you.
Project Website
https://github.com/tenox7/ttyplot

Terminal emulator
Buy this article as PDF
(incl. VAT)
