Measuring performance with the perf kernel tool
top on Steroids
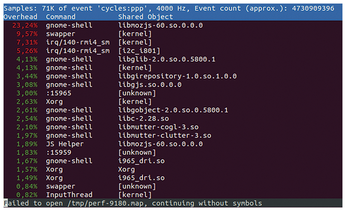
You can create a performance counter profile in real time with perf top (Figure 1). The overview is similar to that of top, but you can jump directly to the individual events.

perf stat counts the events of the entire system until you abort by pressing Ctrl+C, or the specified command terminates. Listing 3 shows the subcommand in action; it lists two events for the factor command.
Listing 3
Output from perf stat
01 $ sudo perf stat -e branches -e branch-misses factor 120808125801214124898080833
02 120808125801214124898080833: 13 29 911 7589 21089 77471 28369829
03
04 Performance counter stats for 'factor 120808125801214124898080833':
05
06 191,242 branches
07 10,332 branch-misses # 5.40% of all branches
08
09 0.000649438 seconds time elapsed
10
11 0.000699000 seconds user
12 0.000000000000 seconds sys
Data Recorder
The perf record command can generate a performance counter profile for a specific command. If you want an overview of the entire system, or if the process to be examined is unknown, simply add the sleep command:
sudo perf record -ag sleep 5
This line creates the default perf.data file in the current directory. The -a switch ensures that perf considers all CPUs, and -g generates a call graph. -i lets you feed a file to perf record.
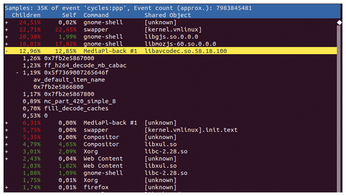
The perf report command evaluates the stored data and uses the perf.data file. As with perf top, the command presents an overview. After pressing Enter, you also see details for the functions.
By the way, the --sort= comm,dso switch (see Figure 1) provides a better overview. Figure 2 shows the output for an Intel Kaby Lake system with Gnome 3.30.1 playing a movie in Firefox 63.0.3. The figure shows that the CPU and not the GPU is used for decoding.

Event-Driven
If only certain events are of interest, the -e switch can help. Listing 4 shows the output on a system with Rsync running.
Listing 4
Track Events
01 $ sudo perf report --stdio
02 [...]
03 # Samples: 1K of event 'block:block_rq_issue'
04 # Event count (approx.): 1741
05 #
06 # Children Self Command Shared Object Symbol
07 # ........  ....  ...........  ................  ....................
08 #
09 93.74% 93.74% rsync kernel.kallsyms] [k] blk_peek_request
10 |
11 |--89.20%-- __lxstat64
12 | blk_peek_request
13 |
14 |--3.45%-- __GI___mkdir
15 | blk_peek_request
16 |
17 |--0.63%-- 0x646c6975622f3930
18 | __GI___link
19 | blk_peek_request
20 |
21 -0.46%-- 0x6d492f636f642f65
22 __GI___link
23 blk_peek_request
24
25 89.20% 0.00% rsync libc-2.27.so [.] __lxstat64
26 |
27 ---__lxstat64
28 blk_peek_request
29 [...]
--stdio tells perf to display the overview in plain text directly on the console. The recorded event was a request to the kernel block layer. The command line was:
sudo perf record -e block:block_rq_issue -ag
« Previous 1 2 3 4 Next »
Buy this article as PDF
(incl. VAT)
