Real-time plots in 20 lines
Simple Line Chart
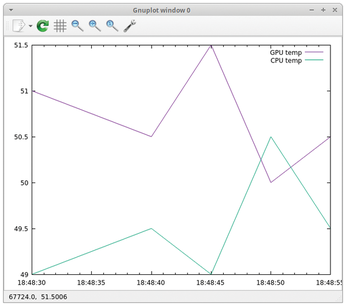
A line chart presentation can be created from a data file (GPU.dat), as well:
# GPU.dat - a time stamp with two data points
18:48:30 51.0 49.0
18:48:40 50.5 49.5
18:48:45 51.5 49.0
18:48:50 50.0 50.5
18:48:55 50.5 49.5
The interactive Gnuplot commands to show a line chart of this data are shown in Listing 2. This Gnuplot script requires a few extra lines: The plot needs to know that the x-axis is time data, and it needs to know the format of the time data and the x labels.
Listing 2
Line Chart from a File
$ gnuplot
gnuplot> # plot 2 variables in the file GPU.dat
gnuplot> #
gnuplot> set xdata time
gnuplot> set timefmt "%H:%M:%S"
gnuplot> set format x "%H:%M:%S"
gnuplot> plot "GPU.dat" using 1:2 with line title "GPU temp" , "GPU.dat" using
    1:3:3 with line title "CPU temp"
Multiple data points can be plotted at the same time (Figure 4). The using argument tells Gnuplot how to reference the <x>:<y> columns in the data file. (If the data file had a third column of data points, the using reference to get the last column of data would be 1:4:4).
Real-Time Line Chart
Linux has a lot of useful command-line troubleshooting tools, such as iostat, vmstat, and top, to name just a few. For the line chart example, I use the sensors utility [3] to get the fan speed and CPU temperature of my Linux server. The sensors command returns a number of lines of information.
$ sensors dell_smm-virtual-0 Adapter: Virtual device Processor Fan: 2676 RPM CPU: +47.0~ZâC Ambient: +38.0âC SODIMM: +37.0âC ...
With some Bash and Awk commands, you can get just the fan speed and CPU temperature (Listing 3).
Listing 3
Parsing Data
$ sensors | grep RPM
Processor Fan: 2685 RPM
$ sensors | grep RPM | awk '{print $3}'
2685
$ sensors | grep CPU
CPU: +48.0âC
$ sensors | grep CPU | awk '{print $2}'
+48.0âC
$ sensors | grep CPU | awk '{print substr($2,2,4)}'
48.0
Awk supports a systime() call to return the present date/time, and a strftime() call to customize the presentation. (Note: You might have to install gawk – sudo apt-get install gawk – on the Raspberry Pi to get this added functionality.)
Once the measurements have been parsed, the next step is to format the sensor output with a timestamp:
$ sensors | grep RPM |awk '{print strftime("%H:%M:%S ",systime()) $3}'
10:26:46 2685
$sensors | grep CPU |awk '{print strftime(\"%H:%M:%S \",systime()) substr($2,2,4)}'
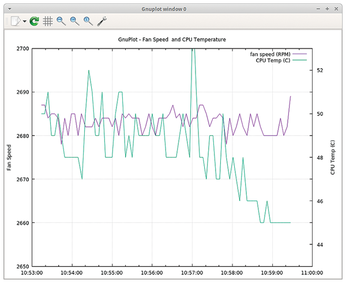
10:27:46 48.0After a time and value string have been generated, you can create a Gnuplot script, line_fan_cpu.txt, to show real-time data (Listing 4). To make the script a little easier, I create two data files, fan.dat and cpu.dat.
Listing 4
Dynamic Line Chart Script
01 # Create a Plot or User and System CPU Usage, update every 5 seconds
02 #
03 set title "GnuPlot - Fan Speed  and CPU Temperature"
04 set yrange [2650:2700]
05 set ylabel "Fan Speed"
06 set y2range [43:49]
07 set y2label "CPU Temp (C)"
08 set y2tics
09 set xdata time
10 set timefmt "%H:%M:%S"
11 set format x "%H:%M:%S"
12
13 system "sensors | grep RPM | awk '{print strftime(\"%H:%M:%S \", systime()) $3}' > fan.dat"
14 system "sensors | grep CPU | awk '{print strftime(\"%H:%M:%S \",systime()) substr($2,2,4)}'  > cpu.dat"
15
16 plot "fan.dat" using 1:2  with lines axes x1y1 title "fan speed (RPM)",  "cpu.dat" using 1:2 with lines axes x1y2 title "CPU Temp (C)"
17 while (1) {
18   pause 5
19   system "sensors | grep RPM | awk '{print strftime(\"%H:%M:%S \", systime()) $3}' >> fan.dat"
20   system "sensors | grep CPU | awk '{print strftime(\"%H:%M:%S \", systime()) substr($2,2,4)}'  >> cpu.dat"
21   replot
22 }
The plot accounts for different scale ranges with y2range and y2label definitions. The final addition is to include an axis (x1y2 or x1y2) to each plot point that lines up the data values to the right or left y-axis.
The complete Gnuplot script to show fan speed and CPU temperature is only 20 lines of code! The command
$ gnuplot -persist line_fan_cpu.txt
runs this script (Figure 5).
Final Comments
I won't give up using plotting packages like Matplotlib or ggplot, but I was very impressed with how easy it was to create real-time plots with Gnuplot.
Manipulating the Bash/Awk script can be a little complex, but it's incredibly useful to be able to use output from almost any command-line utility in Gnuplot.
Gnuplot can plot a large number of data points, but it makes sense to do a tail command to create a sliding view of the latest information.
Infos
- Gnuplot documentation: http://www.gnuplot.info/
- gpio command-line utility: http://wiringpi.com/the-gpio-utility/
- sensors command-line utility: https://wiki.archlinux.org/index.php/Lm_sensors
« Previous 1 2
Buy this article as PDF
(incl. VAT)
Buy Linux Magazine
US / Canada
UK / Australia