Visualize your network with Skydive
Command Line
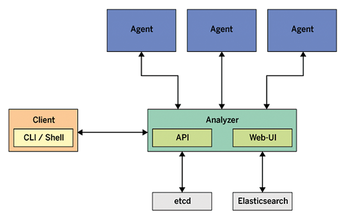
If you don't want to use point & click for troubleshooting, you can use the command line instead. The Skydive client communicates with the analyzer and presents its results in the console window. You don't need an additional program because the client is integrated into the Skydive binary. Whether the client can talk to its analyzer can be checked by posting a simple status query (Listing 4, Line 1).
Listing 4
CLI Queries
# skydive client status # skydive client query G # skydive client query "G.V().Has('Name', 'sd0181')"
If the client and the analyzer are not running on the same server, the client needs the IP address or host name of its counterpart in its command call (use the --analyzer
option). In case of successful contact, the display is filled with information about the connected agents, formatted in the JSON format.
When accessing the entire topology tree (Listing 4, second line), Skydive is copious and reports every detail about every edge and node. It makes more sense to use a targeted query that returns only what you want to know. Skydive uses Gremlin as its query language. An example of a query for a specific node is shown in the last line of Listing 4.
A bit of basic knowledge in Gremlin is needed to create connecting lines in the graph at the command line. The subcommand is not query
but edge-rule create
. Listing 5 creates two nodes, as well as a connecting edge between them.
Listing 5
Creating Nodes and Edges
# skydive client node-rule create --node-name="RT-1" \ --node-type="host" --action="create" { "Name": "", "Description": "", "Metadata": { "Name": "RT-1", "Type": "host" }, "Action": "create", "Query": "", "UUID": "f2043100-434b-426f-7edc-0382f15d788b" } # skydive client node-rule create --node-name="RT-2" \ --node-type="host" --action="create" { "Name": "", "Description": "", "Metadata": { "Name": "RT-2", "Type": "host" }, "Action": "create", "Query": "", "UUID": "a8b59b62-2da7-4532-4ac6-6f94fc898553" } # skydive client edge-rule create \ --src="G.V().Has('Name', 'RT-1')" \ --dst="G.V().Has('Name', 'RT-2')" \ --relationtype="layer2" \ --metadata="key=value" { "Name": "", "Description": "", "Src": "G.V().Has('Name', 'RT-1')", "Dst": "G.V().Has('Name', 'RT-2')", "Metadata": { "RelationType": "layer2", "key": "value" }, "UUID": "1a429d13-025f-405c-740a-b4bf24bb2763" }
Under the hood, the Skydive client accesses the Analyzer API. The programming interface is a regular REST API documented in detail via Swagger [2]. Access is not limited to the Skydive client but also works with the usual HTTP clients Curl, Wget, and Httpie. The search for the node in the graph from the previous paragraph is handled using Httpie with a Gremlin query (Listing 6).
Listing 6
Node Search in the Graph
http POST https://skydive.analyzer:8082/api/topology GremlinQuery="G.V().Has('Name', 'sd0181')"
Security
By default, Skydive does not use encrypted communication. Working without encryption might be fine for a small lab scenario, but a serious setup cries out for more protection. Skydive uses X.509 certificates to secure the communication between the analyzer and its agents.
Skydive does not offer the pre-shared keys variant, so you'll need certificates and a certificate authority. Generating a key pair and a certificate involves exactly the same steps as for a web server or OpenVPN. The analyzer learns about its crypto material from a configuration file (Listing 7):
Listing 7
Crypto Configuration
tls: ca_cert: /etc/ssl/certs/ca-skydive.crt server_cert: /etc/ssl/certs/analyzer.crt server_key: /etc/ssl/certs/analyzer.key # Agents need these two additional lines: client_cert: /etc/ssl/certs/client1.crt client_key: /etc/ssl/certs/client1.key
The Skydive agent receives additional lines that name the client certificate. Every agent always needs its own certificate. However, Skydive does not grumble if the agents happen to share a certificate.
Encryption starts as soon as the participants are kitted out with certificates, the configuration file points to them, and the service is restarted. This also changes web access to the analyzer from HTTP to HTTPS. The add-ons in the next section will now also access the analyzer via TLS and check the server certificate.
If the dataset is in an external database, you should secure access. Elasticsearch has its own certutil
tool that takes care of the keys and certificates. On top of that, there is username- and password-based authentication. On the Skydive side, the configuration is extended to include the credentials for the database (Listing 8).
Listing 8
Login Information Configuration
storage: client_cert: /etc/ssl/certs/client1.crt client_key: /etc/ssl/certs/client1.key myelasticsearch: ssl_insecure: false auth: username: skydive password: uMr8Fv30bX
If several Skydive analyzers need to keep their data in sync and use the key-value database Etcd for this purpose, the analyzers need to have the same level of security. Etcd supports certificates and a user login, but Skydive only uses TLS encryption. Other mechanisms need to replace the missing authentication, for example, Iptables rules or an upstream reverse proxy.
Connected
As an open platform, Skydive can interact with other monitoring systems. For example, the Grafana visualization solution can tap into the collected topology of Skydive via an additional data source and display it graphically on a dashboard. Skydive provides the code for the data source in its Github repository [3]. In order for Grafana to access the desired content, the query needs to use Gremlin syntax. In Figure 4, Grafana fetches the number of concurrent IP connections and displays them in a time-series graph.
Skydive offers plugins for connecting to other monitoring solutions. The list is (still) quite manageable; in addition to Grafana, the only other options are Prometheus and Collectd. Using the Prometheus connector, the Skydive analyzer provides metrics that the Prometheus server collects and processes. With Collectd, this works the other way around: Collectd provides, and the Skydive agent consumes.
If Skydive does not support the monitoring software you are using, there are only two ways to get out of jail: write your own plugin or tap into the API with Curl/Wget.
« Previous 1 2 3 4 Next »
Buy this article as PDF
(incl. VAT)