Visualize your network with Skydive
A picture is worth a thousand words, and sometimes, a visual image of your network can save you hours of troubleshooting. Skydive [1] is an open source network analyzer designed to provide a graphical representation of the IT components and how they interact. I'm not talking about wiring but about the data flows between the nodes. Skydive stores this information in a central location. You can interact with Skydive using a web interface, the command line, or an API.
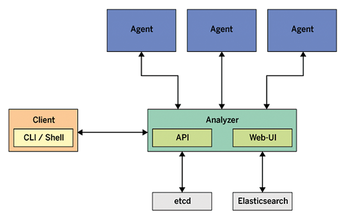
Skydive consists of a central analyzer and many agents (Figure 1). The agents run on Linux hosts and report network configuration and statistics to the analyzer. The analyzer listens to feedback from its agents and stores the input in a database. Gradually, the analyzer gets to know the entire topology and traffic flows between endpoints. The admin can access the new Skydive instance via the analyzer's web interface.
[...]
Buy this article as PDF
(incl. VAT)
Buy Linux Magazine
US / Canada
UK / Australia