Analyze network traffic with Sniffnet
Traffic Monitor

© Photo by Joey Kyber on Unsplash
Network traffic remains a closed book for many users. Sniffnet lets less experienced users monitor their network traffic with ease.
Monitoring network traffic is part of the admin's daily grind. Most admins use the graphical Wireshark tool because of its wealth of functions as well as its availability in most distributions' respositories. Because Wireshark is primarily aimed at professional users, you need in-depth network knowledge to use it. The new Sniffnet project targets less experienced users, providing meaningful results in a simple, intuitive, and clear-cut interface.
Installation
Sniffnet is a cross-platform Rust application [1]. If you don't have the Rust programming language on your system, first set it up with the command from line 2 of Listing 1. The installation routine requires some interactive input and prints some status messages at the prompt. You install Sniffnet itself in the terminal using the Rust package manager, Cargo (line 4).
Listing 1
Install Sniffnet
01 ### Install Rust
02 $ curl --proto '=https' --tlsv1.2 -sSf https://sh.rustup.rs | sh
03 ### Set up Sniffnet via Rust
04 $ cargo install sniffnet
05 ### Install Sniffnet as a DEB
06 $ sudo apt install sniffnet_Linux.deb
07 ### Install dependencies
08 $ sudo apt install libpcap-dev libfontconfig libfontconfig1-dev
If you are using a Linux distribution with a DEB package manager, you can install the precompiled DEB package [2] from the project's GitHub page instead; this removes the need to implement Rust first (line 6).
For the program to work correctly, you will definitely need to resolve some dependencies [3] (line 8), regardless of the installation path. When done, call Sniffnet with the sudo sniffnet command.
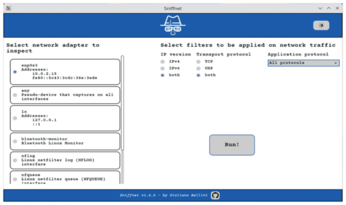
The start-up window opens with the filter options (Figure 1). On the right, you can specify the desired Internet protocol and transport protocols versions by enabling the appropriate radio buttons. In both cases, all available versions are enabled by default (i.e., IPv4 and IPv6, as well as TCP and UDP). On the far right, select the application protocol from more than a dozen options in a drop-down list. Again, Sniffnet takes all protocols into account in the default setting.

On the left of the start-up window, you will find the network interfaces available on the system. Sniffnet lists both the physical and virtual interfaces; Sniffnet always enables the first physical interface. Consequently, you may need to select the desired interface if this doesn't meet your needs. After adjusting the basic settings, click Run!
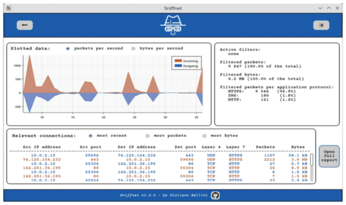
Sniffnet now takes a moment to acquire the available data and then opens the actual monitoring window (Figure 2). At the top, you will see a constantly updated graphical display showing the number of data packets passing through the active network interface per second. This display uses colors to differentiate between incoming and outgoing packets. Alternatively, you can display the transferred data volume in bytes per second by clicking the appropriate radio button under Plotted data. In a small box to the right of the graphical display, you will find some statistical data about the network connection, including the number of filtered packets, their size in megabytes, and the filtered packets per application protocol.

Perhaps the most interesting thing, the Relevant connections box beneath the graphical traffic display contains exact data on the individual connections, consisting of source and target addresses and the ports involved. In addition, you can see the transport and application protocol used for each connection, as well as the number of packets transmitted. On the far right, under the Bytes column, you will also find the volume of data that has been transferred per connection.
Sniffnet also color codes the data in the monitoring window. Incoming connections are shown in a reddish-brown, while outgoing ones are colored blue. You can change this view by clicking a radio button: Click the most packets radio button to display the connections by the number of packets sent or received, or click the most bytes button to sort all packets in descending order by the volume of data transferred.
Complete
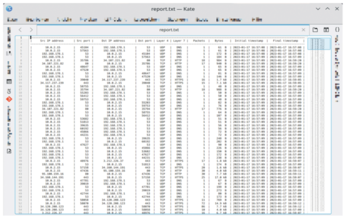
In its graphical display, Sniffnet always shows you the most recent data transfers. To track the network traffic over time, Sniffnet logs all connections and their activities as a table in a text file named $HOME/sniffnet_report/report.txt. To view this text file, click on Open full report to open it in your desktop environment's standard text editor (Figure 3). The application updates the log in near real time.

If you want to change something in the settings during a run, click on the arrow icon in the upper left corner (Figure 2); this will take you back to the main window. It is important to note that Sniffnet deletes the logfile on every restart. If needed, you can save the logs after terminating the application or before restarting the software.
Conclusions
If you want to see what's happening with your network traffic, the largely self-explanatory Sniffnet offers a simple solution for all levels of users. However, the tool lacks analysis capabilities; if you are troubleshooting problems with your network connection, you will need to check the logs manually.
During testing, I found a few bugs. On Kubuntu 22.04, the software refused to open the report when I pressed the Open full report button, but you can work around this by manually opening the file without any problems. A more serious issue: Sniffnet deletes the logfiles almost arbitrarily. Furthermore, Sniffnet does not resolve IP addresses into names – you have to manually find the name for 104.26.7.95. Finally, you cannot copy sequences from the live log; you need to extract them after generating a logfile (if it survives the session). Clearly, Sniffnet still has great potential for improvement.
Infos
- Sniffnet: https://github.com/GyulyVGC/sniffnet
- DEB package: https://github.com/GyulyVGC/sniffnet/releases
- Installation instructions: https://github.com/GyulyVGC/sniffnet#installation
Buy this article as PDF
(incl. VAT)
