Terminal stock price display with Go
Programming Snapshot – Terminal Stock Portfolio

© Lead Image © Jakub Krechowicz, 123RF.com
Instead of pulling up a browser to check his investments, Mike Schilli tracks stock prices with the help of a Go program to display graphs in the terminal.
According to US Vice President Kamala Harris, most US citizens would run out of money if faced by only $400 of unexpected costs. Since hearing this, I have made it my job to check every day whether I still have sufficient financial reserves. This includes tracking the current share price performance of some well-known companies. While there are many apps with portfolio settings that monitor a number of selected shares, I prefer to use command-line tools written in Go that run in a terminal window.
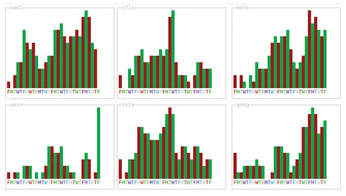
Figure 1 shows the output of the Go Pofo program (Pofo stands for portfolio). The Pofo program's output displays in six tiles (three at the bottom and three at the top), with each tile containing a bar chart to illustrate the share price performance of Apple, Netflix, Meta, Amazon, Tesla, and Google over the past six weeks. The program grabs the current and historical share price data from the data dealer Twelve Data [1] in a fraction of a second shortly after launching. Twelve Data offers a free basic plan for hobbyists that allows up to eight requests per minute and up to 800 per day before a limit kicks in.
[...]
Buy this article as PDF
(incl. VAT)