Add animated drawings to your IoT dashboards
Worth a Thousand Words

Use an SVG graphic widget on your next Node-RED project to get a visual representation of your automation setup.
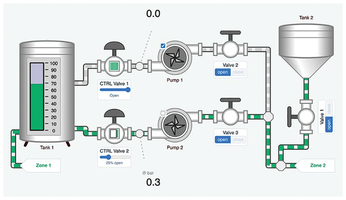
There are some great components for showing tables, gauges, and charts on Internet of Things (IoT) dashboards. For many applications these data widgets are all that you need – however, for industrial or process monitoring projects, it can be extremely helpful to add dynamic visual layouts of the equipment. Figure 1 is an example of a process automation screen that could be used for an industrial control system.
Node-RED [1] is a powerful open source graphical programming tool that you can use for creating IoT logic scenarios and user dashboards. It runs on Linux, macOS, and Windows, and it's an excellent tool for prototyping or building small system solutions. Typical Node-RED projects use the standard dashboard components, but it's also possible to install an SVG widget that lets you show animated graphics alongside the other dashboard objects. Scalable Vector Graphics (SVG) [2] is an XML-based vector image standard that is supported on all major web browsers. SVG files support dynamically changing text, color, rotation, and scaling of objects.
[...]
Buy this article as PDF
(incl. VAT)