Timechart: Zoom in on Operating System
Intel developer Arjan van de Ven is working on a new tool named Timechart that records Linux system performance in detailed graphics.
Van de Ven, who also worked on the energy-saving tool Powertop, wants to enhance tools such as Oprofile, LatencyTOP and Perf with Timechart. The new program provides graphical results, reminiscent of Bootchart, in fact going beyond the boot process analysis tool used as its model by tying in all the other processes on the system.
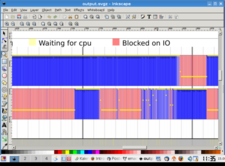
Timechart renders graphics using the SVG vector format and the developer recommends using Inkscape to view the output, which in van de Ven's terms makes them "infinitely zoomable." Easily identifiable graphically are, for example, operating sytem details such as the waiting process for the scheduler -- a contribution the Intel developer can make to the current discussion about schedulers on the kernel mailing list.
Timechart also diagnoses the results of power management settings. The program supports multiprocessor machines. Further details are in van de Ven's blog entry, where he interprets some of the graphical results. The source code is currently posted as patches on the linux-kernel mailing list. A downloadable and installable version is not yet available because of changes still to be made to the kernel infrastructure to make Timechart work.
Timechart developer van de Ven still has some misgivings about the program's name and is thus looking for suggestions in his blog.