Profilers identify bottlenecks in Perl programs
SmallProf Line Profiler
Of course, some modules do not have very sophisticated logging mechanisms. Thankfully, Perl has a number of profilers that measure the amount of time each line of source code uses.
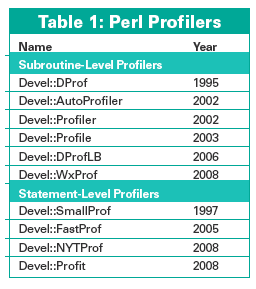
Table 1 shows the major CPAN profilers for various tasks in ascending release order.
The CPAN Devel::SmallProf line profiler autonomously measures run times and formats the data for analysis. If you launch the script you want to test via perl -d:SmallProf ./amzn, the profiler creates a smallprof.out file that lists the time used by each line in each module used.
In the case of a fairly complex action like a web request and ensuing XML analysis of the returned data, the resultant file can be enormous – in this case, it weighed in at no fewer than 25,792 lines.
Discovering the worst time hogs is not an easy task, but the shell command
sort -k 2,2 smallprof.out | less
sorts the file numerically on the second field from the left. This field contains the wall clock time in seconds used by a line of source code, which is the time actually used whether the task gave the CPU something to do or just left it idle, waiting for external events, such as incoming network packages, for example. In addition, the third field contains the CPU seconds, which is the computational time actually used.
If you scroll down to line 17,104 in smallprof.out, as shown in Figure 3, you will see that the line responsible for the wait issues a select command. The can_read function in the LWP::Protocol::http::SocketMethods module is responsible for this.
NYTProf
The CPAN module Devel::NYTProf is a relatively new development [3]. The strange-sounding name came about because the module was developed for the New York Times and based on the Devel::FastProf codebase. Their IT department decided to release the source code.
This excellent profiler is maintained by DBI inventor Tim Bunce [4] today. Bunce presented his work to the Perl community at OSCON 2008 [5]. Although I was in the audience, I couldn't concentrate on his talk because I was up next with my Log4perl talk.
After the CPAN shell-assisted installation (perl -MCPAN -e'install Devel::NYTProf'), you type perl -d:NYTProf amzn to launch the profiler on the script. To convert its binary logfile nytprof.out to professionally formatted HTML, use the nytprofhtml script included with the package.
Firing up a browser and pointing it to the index.html file in the newly created nytprof directory (URL file:///...nytprof/index.html) reveals what has been going on. The table in Figure 4 lists the hotspots. It shows the number of calls, the number of places (P) they have been issued, the files (F) they are located in, and the time spent executing each function. The tool differentiates between "exclusive time" and "inclusive time," the former referring to the time spent exclusively in the function's code and the latter referring to the total time, including the subfunctions called by the function.
Single-Click Analysis
The HTML links the function names with HTML pages providing details on the function code – a very practical idea that lets the user flip back and forth and greatly facilitates the analysis. Figure 5, for example, shows details that were very difficult to obtain with SmallProf; that is, the select() command in the can_read() function in an LWP module is causing the delays. On an open network socket, it waits for the first signs of the response returned by Amazon.
NYTProf supports three different reporting modes for displaying the time spent by the source code: line mode (one time value per line), block mode (one time value per block of Perl), and sub mode (one time value per function). Clicking toggles the performance de-tective through the different display variants.
The module-level view of the profiler in Figure 6 also reveals some interesting facts. The XML analysis of the Amazon web response took 9,963 lines of code and 400 calls to the collapse() function XML::Simple.
Because it ran at full speed, the whole kit and caboodle took just 35msec, but this just goes to show how complex it is to parse XML.
« Previous 1 2 3 Next »
Buy this article as PDF
(incl. VAT)
Buy Linux Magazine
US / Canada
UK / Australia
Subscribe to our Linux Newsletters
Find Linux and Open Source Jobs
Subscribe to our ADMIN Newsletters
Support Our Work
Linux Magazine content is made possible with support from readers like you. Please consider contributing when you’ve found an article to be beneficial.

News
-
So Long Neofetch and Thanks for the Info
Today is a day that every Linux user who enjoys bragging about their system(s) will mourn, as Neofetch has come to an end.
-
Ubuntu 24.04 Comes with a “Flaw"
If you're thinking you might want to upgrade from your current Ubuntu release to the latest, there's something you might want to consider before doing so.
-
Canonical Releases Ubuntu 24.04
After a brief pause because of the XZ vulnerability, Ubuntu 24.04 is now available for install.
-
Linux Servers Targeted by Akira Ransomware
A group of bad actors who have already extorted $42 million have their sights set on the Linux platform.
-
TUXEDO Computers Unveils Linux Laptop Featuring AMD Ryzen CPU
This latest release is the first laptop to include the new CPU from Ryzen and Linux preinstalled.
-
XZ Gets the All-Clear
The back door xz vulnerability has been officially reverted for Fedora 40 and versions 38 and 39 were never affected.
-
Canonical Collaborates with Qualcomm on New Venture
This new joint effort is geared toward bringing Ubuntu and Ubuntu Core to Qualcomm-powered devices.
-
Kodi 21.0 Open-Source Entertainment Hub Released
After a year of development, the award-winning Kodi cross-platform, media center software is now available with many new additions and improvements.
-
Linux Usage Increases in Two Key Areas
If market share is your thing, you'll be happy to know that Linux is on the rise in two areas that, if they keep climbing, could have serious meaning for Linux's future.
-
Vulnerability Discovered in xz Libraries
An urgent alert for Fedora 40 has been posted and users should pay attention.