Visualize your network with Skydive
A picture is worth a thousand words, and sometimes, a visual image of your network can save you hours of troubleshooting. Skydive [1] is an open source network analyzer designed to provide a graphical representation of the IT components and how they interact. I'm not talking about wiring but about the data flows between the nodes. Skydive stores this information in a central location. You can interact with Skydive using a web interface, the command line, or an API.
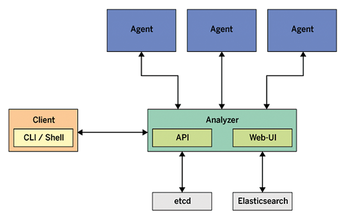
Skydive consists of a central analyzer and many agents (Figure 1). The agents run on Linux hosts and report network configuration and statistics to the analyzer. The analyzer listens to feedback from its agents and stores the input in a database. Gradually, the analyzer gets to know the entire topology and traffic flows between endpoints. The admin can access the new Skydive instance via the analyzer's web interface.
[...]
Buy this article as PDF
(incl. VAT)
Buy Linux Magazine
US / Canada
UK / Australia
Subscribe to our Linux Newsletters
Find Linux and Open Source Jobs
Subscribe to our ADMIN Newsletters
Support Our Work
Linux Magazine content is made possible with support from readers like you. Please consider contributing when you’ve found an article to be beneficial.

News
-
AUR Repository Still Under DDoS Attack
Arch User Repository continues to be under a DDoS attack that has been going on for two weeks.
-
RingReaper Malware Poses Danger to Linux Systems
A new kind of malware exploits modern Linux kernels for I/O operations.
-
Happy Birthday, Linux
On August 25, Linux officially turns 34.
-
VirtualBox 7.2 Has Arrived
With early support for Linux kernel 6.17 and other new additions, VirtualBox 7.2 is a must-update for users.
-
Linux Mint 22.2 Beta Available for Testing
Some interesting new additions and improvements are coming to Linux Mint. Check out the Linux Mint 22.2 Beta to give it a test run.
-
Debian 13.0 Officially Released
After two years of development, the latest iteration of Debian is now available with plenty of under-the-hood improvements.
-
Upcoming Changes for MXLinux
MXLinux 25 has plenty in store to please all types of users.
-
A New Linux AI Assistant in Town
Newelle, a Linux AI assistant, works with different LLMs and includes document parsing and profiles.
-
Linux Kernel 6.16 Released with Minor Fixes
The latest Linux kernel doesn't really include any big-ticket features, just a lot of lines of code.
-
EU Sovereign Tech Fund Gains Traction
OpenForum Europe recently released a report regarding a sovereign tech fund with backing from several significant entities.