Creating charts with LibreOffice Calc
Plotting and Data Visualization
Everybody needs charts sooner or later, and LibreOffice Calc is the easiest way to create them with free and open source software.
Modern life is full of numbers. Even if one is not a mathematician, sooner or later comes the day when it's necessary to quickly understand or share with others the relationships among numbers. This tutorial introduces what is probably the simplest way to do just that with free software, the charts in LibreOffice Calc [1]. But are they charts or graphs? Let's clear up that question first.
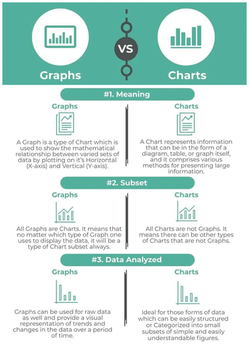
Charts vs. Graphs
Both charts and graphs are tools to summarize and present information in a visual way. While most people use the two terms as if they were synonyms, strictly speaking, they aren't [2]. Some of the reasons are shown in Figure 1, but basically charts summarize datasets in ways that are (hopefully) intuitive and engaging, for example, with bars, pies, or other symbols. The primary purpose of charts is to convey the high-level meaning of data and the connections within it.
[...]
Buy this article as PDF
(incl. VAT)
Buy Linux Magazine
Subscribe to our Linux Newsletters
Find Linux and Open Source Jobs
Subscribe to our ADMIN Newsletters
Support Our Work
Linux Magazine content is made possible with support from readers like you. Please consider contributing when you’ve found an article to be beneficial.

News
-
Yet Another Linux Kernel Vulnerability Discovered
Affecting millions of systems, a kernel flaw discovered by Qualys could allow users to gain root privileges.
-
Ubuntu 26.10 to Include Ubuntu Certified Hardware Check
If you've ever wondered if your laptop or PC is officially certified to run Ubuntu, that curiosity will soon be met.
-
Substantial Update to IPFire Now Available
The lastest version of IPFire features a fundamental change to how the system handles DNS.
-
Gnome Working on Test Center App to Make Testing Easier
It's now possible to test experimental features on the Gnome desktop without worrying that you'll break things.
-
New Vulnerability Discovered in Linux Kernel
Hiding out for nearly 15 years, the Ghostlock vulnerability allows a standard logged-in user to gain root privileges.
-
New Linux Flaw Lets Attackers Escape VMs
A 16-year-old vulnerability allows an attacker to escape a virtual machine, gain access to the host, and execute malicious code.
-
Hannah Montana Linux Is Back!
Developer Noah Cagle decided the world needed the once obscure but beloved Linux distribution and gave it a decidedly pink refresh.
-
System76 Refreshes the Lemur Laptop
If you're looking for a laptop with tons of power and battery, look no further than the latest iteration of the System76 Lemur Pro.
-
More than 43 Million Lines of Code in Linux Kernel 7.2
Using the cloc utility, Michael Larabel of Phoronix discovered that Linux kernel 7.2 has over 43 million lines of code.
-
Kubuntu Focus Goes Ultra
The Kubuntu Focus team has upped the performance ante of its M2 and Zr laptops with the latest, greatest CPUs from Intel.