Sparkling gems and new releases from the world of Free and Open Source Software
magic-trace
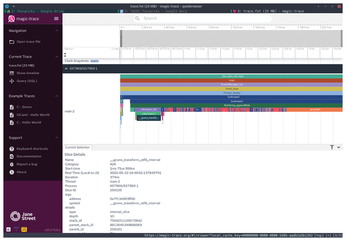
Debugging tools are an important part of the development process. They help programmers compare what is actually happening with what they think should be happening, often revealing all kinds of inadvertent side effects in the process. You've probably already heard of the GNU Debugger (GDB) because it's the most well known, supremely powerful, and nearly always installed alongside the development environment. But it's also complicated and unintuitive outside of an IDE or one of its many third-party GUI visualizers. Magic-trace, on the other hand, is new and an excellent alternative to GDB that can help you introspect what your processes are doing at a higher level and also help anyone more generally interested in what their systems might be doing and how they're doing it. Rather than using GDB, the magic behind magic-trace is the perf command, a similarly venerable Linux tool designed to monitor exactly what your CPU is doing.
In addition to needing perf, magic-trace will only run on a native Intel Skylake CPU or later, from the 6600k onwards, and won't currently run from a virtualized environment. If you can meet these requirements, you then simply type the magic-trace command with either run, followed by the name of the executable you want to examine, or attach, to trace a process that's already running. Both commands offer much more optional control over which threads of a process are traced and at what system level they're monitored. Your process will only run up to 10 percent slower, and every function call is tracked. When you exit or the process ends, the results are compiled into a binary trace file. This binary file can then be loaded into a web-hosted GUI interface at magic-trace.org, a site which can also be self-hosted. This web app maps the call stack across time and allows you to zoom in and around everything that happened during the trace. It's a little like a systemd-analyze plot of the boot process, only for running processes. It's incredibly accurate and dense but equally powerful at letting you see what's taking up your resources in even tiny slices of time.
Project Website
https://github.com/janestreet/magic-trace
Decompiler
Snowman
A debugging tool such as magic-trace (above) is most useful when you have compiled the applications you want to trace with debug mode enabled. This links each element of the binary data within an executable to the original source code used to build the binary, and it can help massively when you need to debug a process or better understand what's happening. Luckily, if you've not built the binary from source code yourself, many distributions include separate debug packages that can be installed to the same effect, letting you see the original source code for an executable when run through a debugging tool. But there are also lots of times when you want to debug or inspect an executable without having any access to the original source code, and this is when a decompiler can help.
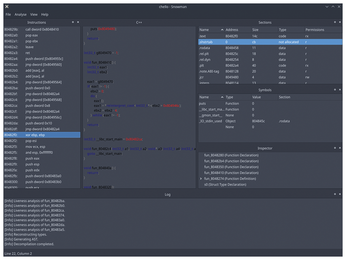
A decompiler turns binary instructions into source code that can then be inspected and potentially rebuilt. Snowman is a new decompiler that has its own GUI and accompanying command-line tools, and it can turn your binaries into C/C++ code that can then be inspected from within the same application. Snowman's Qt-driven interface is simple and easy to use, and you start by opening the executable file you want to look at. Snowman will then quickly show you the assembly decompilation for the code in the left panel before spending some time analyzing the data flows for every function it detects in the code. When this has finished, the right side panel will show the reconstructed C/C++ code. This isn't going to be anything like the original code because every function and variable has been replaced by an arbitrary placeholder name, but it does break down the logical flow of execution from the code, which is easier to read than the binary, especially when helped by the function inspector, symbol table, and binary sections list.
Project Website
https://github.com/yegord/snowman
Buy this article as PDF
(incl. VAT)
Buy Linux Magazine
US / Canada
UK / Australia
Subscribe to our Linux Newsletters
Find Linux and Open Source Jobs
Subscribe to our ADMIN Newsletters
Support Our Work
Linux Magazine content is made possible with support from readers like you. Please consider contributing when you’ve found an article to be beneficial.

News
-
Red Hat Adds New Deployment Option for Enterprise Linux Platforms
Red Hat has re-imagined enterprise Linux for an AI future with Image Mode.
-
OSJH and LPI Release 2024 Open Source Pros Job Survey Results
See what open source professionals look for in a new role.
-
Proton 9.0-1 Released to Improve Gaming with Steam
The latest release of Proton 9 adds several improvements and fixes an issue that has been problematic for Linux users.
-
So Long Neofetch and Thanks for the Info
Today is a day that every Linux user who enjoys bragging about their system(s) will mourn, as Neofetch has come to an end.
-
Ubuntu 24.04 Comes with a “Flaw"
If you're thinking you might want to upgrade from your current Ubuntu release to the latest, there's something you might want to consider before doing so.
-
Canonical Releases Ubuntu 24.04
After a brief pause because of the XZ vulnerability, Ubuntu 24.04 is now available for install.
-
Linux Servers Targeted by Akira Ransomware
A group of bad actors who have already extorted $42 million have their sights set on the Linux platform.
-
TUXEDO Computers Unveils Linux Laptop Featuring AMD Ryzen CPU
This latest release is the first laptop to include the new CPU from Ryzen and Linux preinstalled.
-
XZ Gets the All-Clear
The back door xz vulnerability has been officially reverted for Fedora 40 and versions 38 and 39 were never affected.
-
Canonical Collaborates with Qualcomm on New Venture
This new joint effort is geared toward bringing Ubuntu and Ubuntu Core to Qualcomm-powered devices.