Drawing a clock with Python and the Cairo graphics library

Around the Clock

© Lead Image © rawpixel, 123RF.com

© Lead Image © rawpixel, 123RF.com

Article from Issue 296/2025
Author(s):

Build graphic elements into your Python programs with the Cairo graphics library. We'll show you how to draw an analog clock face that displays the current time.

Tutorials and guides for programming and using command-line tools abound for Linux. Graphics programming, however, is rarely even touched upon. Although drawing graphics is indeed more tedious than printing text on a terminal, and some knowledge of mathematics is usually required, graphics programming is not terribly difficult. In this article, I will demonstrate how to write a functional, usable program to draw an analog clock face to an image file. By the end of this article, you will have a Python program that generates a stylish analog clock depicting the current time (Figure 1).
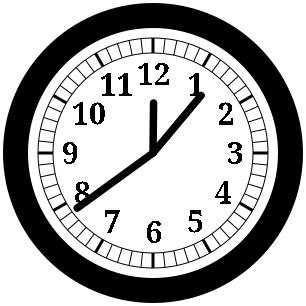
Figure 1: The results of the completed clock program.

For this article, I will use the Cairo [1] graphics library to draw the images. Cairo might not be the most intuitive graphics library at first, but it is ubiquitous: Once you know how to use it, you can quickly adapt to drawing with other libraries, such as the GTK [2] graphical user interface toolkit, which also uses Cairo.

Python is not the only programming language you can use with Cairo: Cairo was originally written for the C language, and so-called "language bindings" are available for most popular languages. For more on coding with Cairo, see the official Cairo documentation [3], as well as the exhaustive programmer's reference [4].

Before you begin, be sure you have both Cairo and its Python module installed. On Debian and its derivatives, you can verify that you have everything you need by running the command:

sudo apt install python3-cairo

A Quick Example

Before diving into how to draw the parts of a clock face, I will show you the basics required to use Cairo. In this example, I will draw an orange horizontal line into a PNG image file measuring 200 pixels square. The line will extend from the left-center edge of the image to the middle, thus spanning half of the image's width. The image is written to a file in the current directory called line.png. Listing 1 contains the program's full source code; Figure 2 shows the resulting image produced by the program.

Listing 1

line.py

01 #!/usr/bin/env python3
02
03 import cairo
04
05 surface = cairo.ImageSurface (cairo.Format.ARGB32, 200, 200)
06 context = cairo.Context (surface)
07
08 context.set_line_width (12)
09 context.set_source_rgb (1., .75, 0.)
10
11 context.move_to (0, 100)
12 context.line_to (100, 100)
13 context.stroke ()
14
15 surface.flush ()
16 surface.write_to_png ('line.png')
Figure 2: An orange horizontal line, drawn with Cairo.

The first step in drawing using Cairo is to create an image surface. A surface is nothing more than a place on which to draw. Cairo can draw to many things: a temporary buffer stored in memory (known as an image surface), a PDF file, an SVG image, even on-screen to an X window [5], just to name a few. For all the examples in this article, I will have Cairo draw into an image surface in memory. Then when I'm done drawing to the surface, I'll instruct Cairo to write the contents of the surface into a PNG file.

surface = cairo.ImageSurface (cairo.Format.ARGB32, 200, 200)

This command creates an image surface, automatically allocating memory for a 200x200 pixel image with support for transparent regions of the image – known as an alpha channel, hence the letter A in cairo.Format.ARGB32.

The next step is to create a context for drawing onto the surface:

context = cairo.Context (surface)

Virtually all functions that draw using Cairo operate on the Cairo context, rather than the surface directly. The context keeps track of parameters used by drawing operations which follow. For example, to draw 12-pixel-thick lines in orange:

context.set_line_width (12)
context.set_source_rgb (1., .75, 0.)

The set_source_rgb () function deserves special attention. It sets the color with which to draw shapes. The parameters to the function are, respectively, the red, green, and blue levels of the color. A value of 1 indicates the maximum level of the color component; a value of 0 omits that color component from the color; and any value between 0 and 1 is a fraction of the color component's maximum intensity. Orange consists of red (1.), a somewhat lesser amount of green (.75), and no blue (0.).

Now it's time to draw the line:

context.move_to (0, 100)
context.line_to (100, 100)
context.stroke ()

This begins the line at the horizontal position (X) 0, ends it at the center of the image (an X position of 100 pixels), and centers the line vertically. Note that Cairo draws half of the line above the requested vertical position and half of it below; so the top of the line is actually positioned at the 94-pixel position and the bottom at the 106-pixel mark. This fact becomes important if you draw lines that are only a single pixel thick; at that point, an effect known as antialiasing comes into effect and can produce fuzzy lines (see the "Antialiasing" box).

Antialiasing

Since pixels are a fixed size, and an image is composed of only a limited number of pixels, shapes which are not perfect rectangles – or not perfectly aligned to an even pixel unit – cannot be represented perfectly in a digital image. To disguise these imperfections, a technique known as antialiasing is applied to the image. Antialiasing involves adding semi-transparent pixels around the affected areas of the shape, thus blurring the edges of the shape so as to cover up some of the imperfection. If the line is only one pixel thick, the edge is the whole line, so the line itself will look blurry.

Finally, make sure that all drawing operations are applied to the surface, and then write the contents of the surface to a PNG file:

surface.flush ()
surface.write_to_png ('line.py')

It is necessary to "flush" the surface first since Cairo often delays drawing to the surface; if a later drawing operation would draw over the top of a previous shape, there is no need to draw that previous shape in the first place, which could increase the efficiency of the program.

To try out this program, first ensure it is executable, and then run it:

$ chmod +x line.py
$ ./line.py

It should create a new PNG file in the current directory, with the contents as shown in Figure 2.

The Clock Background and Bezel

Now it's time to start drawing the parts of the clock, starting with the white background of the clock face, and the thick black bezel surrounding the clock. Both of these are circles; instead of drawing lines as I did previously, I will use Cairo to draw arcs, one filled with white, the other as a black outline.

In the previous example, I drew into a 200x200 pixel image. In this following example, where I start drawing the actual clock face, I draw into a 300x300 pixel image; 200x200 pixels is slightly too small to easily see all of the intricate details of a clock face. Keep this image size change in mind as you read on; for instance, the center of the image will be at 150 pixels rather than 100 pixels as it was in the last section.

Now, in addition to importing the cairo Python library, I need the math module as well:

import math

I need the math module because it provides a value for the mathematical constants pi and tau. As you will see shortly, I will use these constants to specify the extents of the arcs – in this case, I want full circles, so I will specify the extents as 2*pi radians, which is 360 degrees.

To draw the white background of the clock face, I use:

context.set_source_rgb (1., 1., 1.)
context.arc (150, 150, 150, 0, 2*math.pi)
context.fill ()

This draws the arc in white (1., 1., 1.). It centers the arc at the center of the image (the first two parameters to arc (), 150, 150), with a radius of 150 pixels (third parameter). It starts the arc at a zero-degree angle and draws all the way around to a full circle, or 2*pi radians (360 degrees). Instead of drawing a line encircling the arc, I instead fill the arc.

Instead of using pi and multiplying by 2, I could have used tau:

context.arc (150, 150, 150, 0, math.tau)

Using tau in lieu of pi may be advantageous to improve the efficiency of a program, as tau has already been calculated ahead of time; multiplying pi by 2 every time it is needed will require more computing resources. Graphics programs often involve a lot more math as they get more complex, and more math means more computing power required; improving efficiency can noticeably improve the speed of a more complex program.

Now I'll draw a 25-pixel-thick black bezel encircling the background:

context.set_source_rgb (0., 0., 0.)
context.set_line_width (25)
context.arc (150, 150, 137.5, 0, 2*math.pi)
context.stroke ()

Notice that the radius is not 150 pixels but 137.5 pixels. This is because I'm going to draw a 25 pixel band around the circle, and Cairo draws half of the "stroke" above the circle and half below. Hence I reduce the circle's radius by 12.5 pixels, half of the 25 pixel line thickness.

Listing 2 contains the full code required to draw the clock background and bezel. When run, it should produce a PNG file named clock.png, as shown in Figure 3.

Listing 2

clock-frame.py

01 #!/usr/bin/env python3
02
03 import math
04 import cairo
05
06 surface = cairo.ImageSurface (cairo.Format.ARGB32, 300, 300)
07 context = cairo.Context (surface)
08
09 context.set_source_rgb (1., 1., 1.)
10 context.arc (150, 150, 150, 0, 2*math.pi)
11 context.fill ()
12
13 context.set_source_rgb (0., 0., 0.)
14 context.set_line_width (25)
15 context.arc (150, 150, 137.5, 0, 2*math.pi)
16 context.stroke ()
17
18 surface.flush ()
19 surface.write_to_png ('clock.png')
Figure 3: A skeleton of the clock, with the black frame and the white background.

Scalability and Transforms

So far, I have been supplying fixed dimensions to each of the Cairo functions I have used. From the width and height of the image, to the positions and sizes of each shape, I have specified exact, known numeric values, even pre-calculating them if necessary. But any serious program needs to deal with scenarios such as when the image dimensions change: If this program were added to a graphical user interface, it would generally make sense for the clock to change size as the user resizes the window. For this reason, I will rewrite the program such that the clock can scale to any image dimensions, even if the image is not square (i.e., the width and height are not equal). In addition, from now on, any additions to this program will be similarly scalable; throughout the remaining sections of this article, I will continue to write the program with as few fixed values as possible.

I still need to get the image dimensions from somewhere. As already mentioned, I could get them from the width and height of a graphical user interface window. For the purposes of this program, I will keep them as fixed values, but I will assign them to named constants, which I define at the top of the program (for clarity, I use the convention of printing the names of constants in capital letters):

IMAGE_WIDTH  = 300
IMAGE_HEIGHT = 300

The parameters to Cairo drawing functions, as well as calculations of all other parameters, will directly or indirectly involve one or both of these constants.

It should be theoretically possible to draw the clock into an image whose width does not match its height – once again, one example is if a user resizes the window containing the clock; it is highly unlikely that the user will resize the window to a perfect square. A conventional analog clock is a circle; if the program draws the clock to span the entirety of both dimensions of the image, and the image is not square, then the clock will be drawn as an oval. Besides being odd-looking, such an uneven clock also would make the mathematics of drawing the clock more complicated, especially drawing the hands. Therefore I have opted to draw the clock at a diameter equal to the smaller image dimension and center the clock on the larger dimension:

clock_diameter = min (IMAGE_WIDTH, IMAGE_HEIGHT)
clock_radius = clock_diameter/2

Most calculations that take place from here on will be relative to clock_diameter. I also calculate the clock radius here since it, too, will be used very often – clock_radius uses less space than clock_diameter/2 when printed in the magazine.

To center the clock on the image, I perform a translation, which is nothing more than an instruction to Cairo to add a specific amount to a dimension each time a drawing operation specifies a set of coordinates:

context.translate ((IMAGE_WIDTH-clock_diameter)/2, (IMAGE_HEIGHT-clock_diameter)/2)

Now, suppose I specify an image width of 400 pixels and an image height of 280 pixels. The image is wider than it is tall, so the program will draw the clock with a diameter of 280 pixels (equal to the image height). To center the clock on the image, half of the "extra" width of the image will be used as padding to the left of the clock, while the other half will appear to the right; that means all parts of the clock must be shifted over to the right by 400/2 - 280/2, or 60 pixels. The translate () function above tells Cairo that, from now on, the X component specified to all subsequent drawing operations in the program should be adjusted by 60 pixels. Thus, the following code, which draws the white clock face background, will draw the circle centered not at coordinates (140, 140) as you might at first expect, but at (200, 140):

context.arc (clock_radius, clock_radius, clock_radius, 0, 2*math.pi)

Without the translation, the circle would be centered at (140, 140), leading to a clock drawn on the left side of the image and a lot of empty space to the right.

Now, drawing the bezel requires more calculations. Previously, I specified the thickness of the bezel as a fixed width: 25 pixels. But if the clock grows or shrinks beyond its original diameter of 300 pixels, the bezel should correspondingly grow or shrink, or otherwise the bezel might look either too thin or too thick. A quick calculation reveals that a bezel thickness of 25 pixels for a clock that is 300 pixels in diameter is a ratio of 1:12; therefore, I now calculate the thickness of the bezel by dividing the diameter of the clock by 12; and while I'm at it, I similarly calculate the radius of the bezel:

bezel_width = clock_diameter/12
bezel_radius = clock_radius - bezel_width/2

Just as I replaced the fixed-value parameters to the Cairo function to draw the clock face background above, I also use the values just calculated as parameters to the functions to draw the bezel:

context.set_line_width (bezel_width)
context.arc (clock_radius, clock_radius, bezel_radius, 0, 2*math.pi)

In all other respects, though, the program remains the same as it was when it used the fixed values. Figure 4 illustrates the output of the program when I choose non-square image dimensions – in this case, 400x300 pixels.

Figure 4: The clock frame, now that it can scale to any image dimensions. I have manually added a border around the boundaries of the image to more clearly demonstrate that the clock is horizontally centered on the image.

An analog clock face usually has two types of markings encircling it. The first are the lines to which the hour, minute, and second hands point. The other marks are the numerals denoting the hour. The numerals are simply a form of text, which involves some extra complications that I will not cover just yet.

The indicator lines, on the other hand, involve no drawing operations I haven't yet covered. The marks themselves are nothing more than lines, although most of the lines will be diagonal (I have so far only demonstrated drawing a horizontal line). Clocks usually have circles surrounding the marker lines, but these are even easier to implement, as they are simply stroked arcs much like the clock bezel.

Despite having previously made all other parts of the clock scale in size with the clock itself, I have opted to assign fixed thicknesses to the indicator markings, including the surrounding circles. There are 60 lines total, one for each second (or minute) to which one of the clock hands might point. One out of every five marks is drawn with extra thick lines, corresponding to the indicators for each of the 12 hours to which the hour hand might point. I have chosen to draw the majority of the marks and the surrounding circles with a line thickness of one pixel; the marks for the hour hand (the "major" marks) are drawn 3 pixels wide:

MARK_WIDTH = 1
MAJOR_MARK_WIDTH = 3

The length of the lines, however, should scale with the size of the clock. In addition, an analog clock usually has a small gap between the inside of the bezel and the marks, and this gap should scale with the clock also. For a 300 pixel clock, I find a gap of 10 pixels and a line length of 15 pixels to be aesthetically optimal, so I put the appropriate ratios into the program:

bezel_to_marks_gap = clock_radius/15
mark_length = clock_radius/10

At this point, and from now on, it is more convenient to specify the coordinates of objects to be drawn – lines, circles, and eventually the numerals – relative to the center of the clock, rather than relative to the top-left corner of the image as I have done so far. To do this, I apply another translation on top of the existing transformation:

context.translate (clock_radius, clock_radius)

Now, the coordinates (0,0) refer to the center of the clock; an X coordinate of clock_radius refers to the right edge of the clock, whereas an X coordinate of -clock_radius refers to the left edge. Likewise, a Y coordinate of clock_radius refers to the bottom edge of the clock, whereas -clock_radius refers to the top. Values in between refer to points within the inside of the clock face.

Next I calculate two new values, both of which are distances relative to the center of the clock. Each indicator marking on the clock is a line consisting of two points; as each one of these lines is mark_length pixels long, one of the points on each line is mark_length pixels closer to the clock's center than the other point:

mark_start_distance = clock_radius - bezel_width - bezel_to_marks_gap
mark_end_distance = mark_start_distance - mark_length

But these values are not just useful for determining the coordinates of each point of each indicator mark; I also use them to determine the radiuses of the inner and outer circles surrounding the indicator marks, which I will draw right now in single-pixel thickness:

context.set_line_width (MARK_WIDTH)
context.arc (0, 0, mark_start_distance, 0, 2*math.pi)
context.stroke ()
context.arc (0, 0, mark_end_distance, 0, 2*math.pi)
context.stroke ()

The next part, drawing the actual indicator marks, involves some mathematics. This part is executed inside a for loop that repeats 60 times, once for each mark; for each run of the loop, the variable i is incremented, starting with a value of 0 and ending up with a final value of 59. For each mark, I calculate the angle at which the mark is to be drawn. As I briefly mentioned earlier, a complete circle (360 degrees) is 2*pi radians; there are 60 marks on the clock, which means each mark is 1/60th of a full circle away from the previous mark:

angle = 2*math.pi/60 * i

I want to draw "major" marks (one mark out of every five) using thick lines, so I set the line thickness depending on whether i is evenly divisible by 5 (% is the mathematical "modulus" operator, which simply returns the remainder of a division operation on two numbers):

if i % 5 == 0:
  context.set_line_width (MAJOR_MARK_WIDTH)
else:
  context.set_line_width (MARK_WIDTH)

I know the angle at which each mark is to be drawn, but Cairo needs the start and endpoints of each line, so I need to figure that out. I want to draw the first mark at the very top of the clock, moving clockwise around the clock until there are no more marks to draw. Hence, the first mark should be horizontally centered and vertically at the extreme top of the clock; now that I have established all coordinates relative to the center of the clock, the X coordinates of the line should be zero, while the Y coordinates should be as negative as possible. As I approach a quarter-way around the clock, X should increase towards its maximum value, whereas Y should simultaneously increase towards zero. As I approach halfway around the clock, X should again decrease towards zero, and Y should continue to increase towards its maximum; by that point, the mark will appear at the bottom of the clock. This circular motion continues all the way around the clock (see Figure 5).

Figure 5: Visualizing the X and Y coordinates of the points that make up the lines of each clock indicator mark.

The mathematical functions sine and cosine, implemented in Python as math.sin () and math.cos (), are perfect for this purpose. Given an angle between 0 and 2*pi radians, math.sin () returns a value between negative 1 and positive 1: At an angle of 0 radians, it returns zero; at pi/2 (90 degrees), it returns 1; at pi, zero again; and at pi*3/2 (270 degrees), negative 1. At intermediate angles, it returns intermediate values in a smooth progression. Cosine is similar; it is effectively the sine of an angle offset by 90 degrees. The cosine of zero radians is 1; likewise, the cosine of pi/2 radians is zero, at pi, negative 1, and so on.

By multiplying the sine of the indicator mark angle by the distance from the clock's center to the start or endpoint of the mark, I can thus find the X coordinate of each point of the mark. Likewise, multiplying the negated cosine of the angle by the respective distance, I can find the Y coordinate of each point of the same mark:

context.move_to (mark_start_distance * math.sin (angle),
  mark_start_distance * -math.cos (angle))
context.line_to (mark_end_distance * math.sin (angle),
  mark_end_distance * -math.cos (angle))
context.stroke ()

With all of that said and done, the indicator marks and the surrounding circles have been drawn. Figure 6 illustrates the results of running the program.

Figure 6: The clock face, bezel, indicator marks, and thin shroud encircling the marks. Take note that every five marks – the ones marking each hour – are thicker than the rest of the indicator marks.

Buy this article as PDF

Express-Checkout as PDF
Price $2.95
(incl. VAT)

Buy Linux Magazine

SINGLE ISSUES
 
SUBSCRIPTIONS
 
TABLET & SMARTPHONE APPS
Get it on Google Play

US / Canada

Get it on Google Play

UK / Australia

Related content

  • Graphics in Python with Cairo and GTK

    Add graphics that automatically update. We show you how to build an analog clock widget with the Cairo and GTK libraries.

  • Blender

    With a little help from Blender you can create your own 3D models – including animations. This article shows you how to assemble a partially automated virtual watch model with Blender and Python.

  • DIY Alarm Clock

    A few electronic components, some code, and a hand-made wooden case make a fine retro-style bedside clock.

  • Bang! Ding! Crash!

    To create an action-packed game with LÖVE, these are a few last things you should learn how to do – overlay fancy images to "physical" objects, detect collisions, and get input from the keyboard or mouse.

  • Programming Snapshot – Go Racing Game

    The fastest way through a curve on a racetrack is along the racing line. Instead of heading for Indianapolis, Mike Schilli trains his reflexes with a desktop application written in Go, just to be on the safe side.

comments powered by Disqus
Subscribe to our Linux Newsletters
Find Linux and Open Source Jobs
Subscribe to our ADMIN Newsletters

Support Our Work

Linux Magazine content is made possible with support from readers like you. Please consider contributing when you’ve found an article to be beneficial.

Learn More

News