This trusty troubleshooting tool can track processes along with network traffic
Detective Work

© Lead Image © rudall30, 123RF.com
The legacy Tcpdump is a tool no admin would want to do without, but it is a bit long in the tooth. The eBPF-based Ptcpdump aims to counter this worry. The rewrite offers extensive CLI compatibility and can even display process information.
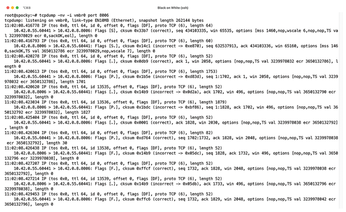
Tcpdump [1] is a popular tool for capturing network traffic. Most admins are aware that they can use Tcpdump to save a record of network traffic in the Pcap format [2], then analyze and visualize the traffic using a protocol analysis tool such as Wireshark. In-depth troubleshooting with Tcpdump is often the last resort when you have exhausted all other options and you still can't open a network connection (Figure 1).

On the downside, many users are annoyed by the fact that Tcpdump can't map network traffic to specific processes. In other words, Tcpdump cannot tell you which program the logged packets belong to. As a workaround, programs can sometimes be identified on the basis of IP addresses and their in- and outbound ports.
The reason why Tcpdump can't assign network traffic to individual programs is because it first switches network interfaces into promiscuous mode in order to see all incoming packets. By doing this, it works around some of the security functions that the Linux kernel actually dictates before you can sniff network connections; however, at the network level, Linux itself does not offer a way to correlate programs and traffic. Also, Tcpdump does not offer the option to group and output the information on the system; you cannot simply tell the program to read packets from certain programs and ignore the rest.
When Tcpdump was created, the Linux kernel did not offer anywhere near the present level of functionality. Theoretically, it should be possible to modify and provide the required functions for process tracking, but no one has done this work thus far.
Luckily, today's Linux systems support a VM environment called the Extended Berkeley Packet Filter (eBPF) that can load and execute any software from userspace. Programs that rely on eBPF on Linux have complete access to the entire kernel space, provided the administrator sets things up accordingly.
You can use eBPF to create comprehensive firewall implementations in the kernel that do not rely on the less-than-popular Netfilter. However, eBPF does not actually have to manipulate the network traffic in the kernel; instead, it can restrict its activity to logging. Developers were able to create a Tcpdump alternative called Ptcpdump that's based on eBPF technology and is capable of seeing all the data traffic while still getting access to the kernel's PID tables.
Ptcpdump
Ptcpdump (Figure 2) essentially acts as an in-kernel VM that can identify and inspect the traffic of individual processes. The tool is not particularly well known. If you search for Ptcpdump on the Internet, you'll find the GitHub directory [3] belonging to Huang Huang, the tool's main author. Ptcpdump is open source and released under the MIT license. Its concept is based on Skbdump [4], another package inspector based on eBPF, which jschwinger233 wrote in C. Skbdump's author lost interest in the tool soon after completing the first few versions, although he is still active in the eBPF universe.

Ptcpdump is a different story: Huang Huang wrote the tool in Go and is actively involved in the ongoing development. Ptcpdump already offers various features that were on the roadmap for Skbdump but never saw the light of day. These features include logging packets from virtual network devices simulated at the software level (TUN devices). Anyone who frequently works with containers or standard VMs needs TUN support. Ptcpdump is designed as a drop-in replacement for Tcpdump, and many of the same commands will work for both tools (see the box entitled "CLI Compatibility").
CLI Compatibility
When tools such as Ptcpdump set out to replace established predecessors, compatibility at command-line level is a crucial question. Many administrators know the CLI calls for the most important tools by heart. Designing the new tool to support the old commands can speed adoption and flatten the learning curve.
Ptcpdump has adopted most of the parameters from Tcpdump. This means that ptcpdump -nv -i Interface -w trace.pcapng
creates a Pcap file with the content you would expect if you are a Tcpdump user. See the Ptcpdump GitHub directory for a complete overview of all of Tcpdump's CLI parameters and the degree to which they are supported in Ptcpdump.
Differences with regard to the supported options mainly relate to features that one of the two tools does not provide. For example, Ptcpdump supports the --pid
parameter to track the traffic of a specific PID, whereas Tcpdump lacks an equivalent.
Close Inspection
Ptcpdump is still relatively new and has not been adopted by most of the popular distributions yet, but ready-to-run binaries for the x86_64 and ARM64 architectures are available on the project's GitHub page. If you have a build environment for Go, you can also compile the tool locally.
To install Ptcpdump, simply download the tarball, unpack it, and move ptcpdump
to /usr/local/bin/
(Figure 3). You can then start tracking data streams, because the mandatory eBPF is available and enabled on all state-of-the-art Linux distributions.

Some system administrators might be alarmed the first time they run Ptcpdump, because the tool initially throws error messages on systems without a Docker runtime environment. But you don't need to worry: None of this affects the functionality. Instead, it is evidence of another Ptcpdump feature that is particularly practical in Kubernetes-based environments: native integration into container workloads.
Docker is known to have a relatively complex network of bridges and other types of network interfaces. With Tcpdump, admins need to search through these interfaces if they want to view the network traffic of a specific container. Ptcpdump removes the extra steps by providing native integration into both Docker and Kubernetes. You only need to enter the PID or ID of the container you wish to monitor. The sniffing tool takes care of the remaining work automatically, as long as the Docker runtime environment is installed and active.
Output Formats
Ptcpdump can certainly overwhelm with information, but it doesn't have to. You can easily tailor the output to your needs. If you call the tool without specific parameters to define the output, it simply lists the name of the process and the PID identified as the source or destination of the traffic in the output. In the first example from Listing 1, you can see the data traffic from the wget
process with a process ID of 3533008
. The traffic originates from a Docker container named test
, which in turn belongs to the test.default
pod.
Listing 1
Output Examples
### Example 1 9:32:09.718892 vethee2a302f wget.3553008 In IP 10.244.0.2.33426 > 139.178.84.217.80: Flags [S], seq 4113492822, win 64240, length 0, ParentProc [python3.834381], Container [test], Pod [test.default] 09:32:09.718941 eth0 wget.3553008 Out IP 172.19.0.2.33426 > 139.178.84.217.80: Flags [S], seq 4113492822, win 64240, length 0, ParentProc [python3.834381], Container [test], Pod [test.default] ### Example 2 09:32:09.718892 vethee2a302f wget.3553008 In IP 10.244.0.2.33426 > 139.178.84.217.80: tcp 0, ParentProc [python3.834381], Container [test], Pod [test.default] 09:32:09.718941 eth0 wget.3553008 Out IP 172.19.0.2.33426 > 139.178.84.217.80: tcp 0, ParentProc [python3.834381], Container [test], Pod [test.default] ### Example 3 13:44:41.529003 eth0 In IP (tos 0x4, ttl 45, id 45428, offset 0, flags [DF], proto TCP (6), length 52) 139.178.84.217.443 > 172.19.0.2.42606: Flags [.], cksum 0x5284, seq 3173118145, ack 1385712707, win 118, options [nop,nop,TS val 134560683 ecr 1627716996], length 0 Process (pid 553587, cmd /usr/bin/wget, args wget kernel.org) ParentProc (pid 553296, cmd /bin/sh, args sh) Container (name test, id d9028334568bf75a5a084963a8f98f78c56bba7f45f823b3780a135b71b91e95, image docker.io/library/alpine:3.18, labels {"io.cri-containerd.kind":"container","io.kubernetes.container.name":"test","io.kubernetes.pod.name":"test", "io.kubernetes.pod.namespace":"default","io.kubernetes.pod.uid":"9e4bc54b-de48-4b1c-8b9e-54709f67ed0c"}) Pod (name test, namespace default, UID 9e4bc54b-de48-4b1c-8b9e-54709f67ed0c, labels {"run":"test"}, annotations {"kubernetes.io/config.seen":"2024-07-21T12:41:00.460249620Z","kubernetes.io/config.source":"api"})
If you prefer something more compact, you can set the -q
option in the command line (Listing 1, second example). Details regarding the TCP/IP sequence numbers and the connection flags are left out in this case, but other key information about the processes involved in the system is still included.
If you want particularly detailed output, use the -v
option instead of -q
(Listing 1, third example). Ptcpdump then provides all the information it collects, including details of the original containers, their PIDs, the associated K8s namespaces, and so on.
As you can see from the output, Ptcpdump doesn't just read container details but also recognizes and interprets the annotations from Kubernetes (Figure 4). You can also use options to show or hide specific details as needed. For example, the --context=process
parameter would only display the Process
line, whereas --context=process,container
also displays the container line.

All told, Ptcpdump provides exactly the level of information you need for debugging. The tool would be even more practical if you could connect directly to Kubernetes to dynamically read the details of the containers, but this feature is not yet available.
Buy this article as PDF
(incl. VAT)
Buy Linux Magazine
Subscribe to our Linux Newsletters
Find Linux and Open Source Jobs
Subscribe to our ADMIN Newsletters
Support Our Work
Linux Magazine content is made possible with support from readers like you. Please consider contributing when you’ve found an article to be beneficial.

News
-
Happy Birthday, Linux
On August 25, Linux officially turns 34.
-
VirtualBox 7.2 Has Arrived
With early support for Linux kernel 6.17 and other new additions, VirtualBox 7.2 is a must-update for users.
-
Linux Mint 22.2 Beta Available for Testing
Some interesting new additions and improvements are coming to Linux Mint. Check out the Linux Mint 22.2 Beta to give it a test run.
-
Debian 13.0 Officially Released
After two years of development, the latest iteration of Debian is now available with plenty of under-the-hood improvements.
-
Upcoming Changes for MXLinux
MXLinux 25 has plenty in store to please all types of users.
-
A New Linux AI Assistant in Town
Newelle, a Linux AI assistant, works with different LLMs and includes document parsing and profiles.
-
Linux Kernel 6.16 Released with Minor Fixes
The latest Linux kernel doesn't really include any big-ticket features, just a lot of lines of code.
-
EU Sovereign Tech Fund Gains Traction
OpenForum Europe recently released a report regarding a sovereign tech fund with backing from several significant entities.
-
FreeBSD Promises a Full Desktop Installer
FreeBSD has lacked an option to include a full desktop environment during installation.
-
Linux Hits an Important Milestone
If you pay attention to the news in the Linux-sphere, you've probably heard that the open source operating system recently crashed through a ceiling no one thought possible.