Filtering log messages with Splunk
Needle in a Haystack
Splunk has mastered the art of finding truly relevant messages in huge amounts of log data. Perlmeister Mike Schilli throws his system messages at the feet of a proprietary analysis tool and teaches the free version an enterprise feature.
To analyze massive amounts of log data from very different sources, you need a correspondingly powerful tool. It needs to bring together text messages from web and application servers, network routers, and other systems, while also supporting fast indexing and querying.
The commercial Splunk tool [1] has demonstrated its skills in this field even in the data centers of large Internet companies, but the basic version is freely available for home use on standard Linux platforms. After the installation, splunk start
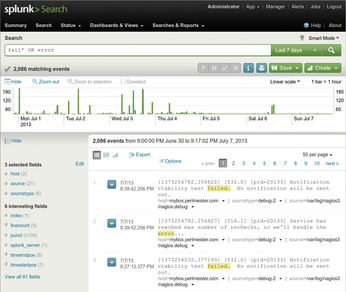
launches the daemon and the web interface, where users can configure the system and dispatch queries, as on an Internet search engine (Figure 1).
Panning for Gold
Easy and fast access to geographically distributed log messages via an index on a local search engine helps detect problems quickly. The powerful search syntax supports not only full-text searches against the database but also in-depth statistical analysis, like, "What are the 10 most frequently occurring URLs that all of my web servers together have delivered in the past two hours?"
Oftentimes, interesting news get drowned in a sea of chatty logfiles. With Splunk, users can gradually define event types that they are not interested in, and the tool removes them from the results. Event types also can be combined to create higher level search functions, so that even Splunk novices can expand their queries with new filters after a short training period, much like real programmers. After some panning of the flow of information, often a few handy nuggets will finally see the light of day. Caution: The free basic version could be a gateway drug to lure you into paying for the Enterprise version one day.
Structured Imports
Splunk interprets the lines of a logfile as events and splits up messages into separate fields. For example, if the access log of a web server contains GET /index.html
, then Splunk sets the method
field to GET
and the uri
field to /index.html
(Figure 2).
Splunk natively understands a number of formats such as syslog, the web server error logs, or JSON, so that the user does not need to lift a single finger to structure and import this data. To import local logfiles of any Linux distro, go to the Add data menu and configure a directory such as /var/log
(Figure 3). The Splunk indexer then assimilates all the files below this level. If the files change dynamically, the Splunk daemon also grabs the new entries; queries now also cover the new information.
You can import other formats by instructing Splunk, for example, to use regular expressions to extract fields from message lines. Splunk also adds internal meta information to the existing fields in the log entry. For example, the source
field of an event defines the file from which the information originates (if it comes from a file, that is), and host
defines the server that generated the event and therefore created the log entry in the first place.
Less Than 500MB or Pay Up
The free version of the Splunk indexer digests up to 500MB of raw data per day; if you feed more to it, you are in violation of the license terms, and it will not work more than three days a month. If you nevertheless risk doing this, Splunk turns off the search feature, forcing you to purchase an enterprise version. Its price is amazingly high; large amounts of data in particular could tear large holes in your budget. In Silicon Valley, the rumor is that Splunk has many large corporate clients, despite the high cost, because the benefits of efficiently finding needles in an absurdly large haystack are very valuable to them.
Buy this article as PDF
(incl. VAT)