Filtering log messages with Splunk
Needle in a Haystack

Splunk has mastered the art of finding truly relevant messages in huge amounts of log data. Perlmeister Mike Schilli throws his system messages at the feet of a proprietary analysis tool and teaches the free version an enterprise feature.
To analyze massive amounts of log data from very different sources, you need a correspondingly powerful tool. It needs to bring together text messages from web and application servers, network routers, and other systems, while also supporting fast indexing and querying.
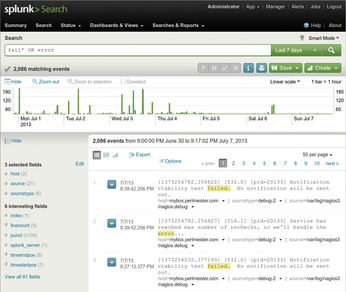
The commercial Splunk tool [1] has demonstrated its skills in this field even in the data centers of large Internet companies, but the basic version is freely available for home use on standard Linux platforms. After the installation, splunk start launches the daemon and the web interface, where users can configure the system and dispatch queries, as on an Internet search engine (Figure 1).
[...]
Buy this article as PDF
(incl. VAT)
Buy Linux Magazine
US / Canada
UK / Australia
Subscribe to our Linux Newsletters
Find Linux and Open Source Jobs
Subscribe to our ADMIN Newsletters
Support Our Work
Linux Magazine content is made possible with support from readers like you. Please consider contributing when you’ve found an article to be beneficial.

News
-
Linux Mint 22.3 Now Available with New Tools
Linux Mint 22.3 has been released with a pair of new tools for system admins and some pretty cool new features.
-
New Linux Malware Targets Cloud-Based Linux Installations
VoidLink, a new Linux malware, should be of real concern because of its stealth and customization.
-
Say Goodbye to Middle-Mouse Paste
Both Gnome and Firefox have proposed getting rid of a long-time favorite Linux feature.
-
Manjaro 26.0 Primary Desktop Environments Default to Wayland
If you want to stick with X.Org, you'll be limited to the desktop environments you can choose.
-
Mozilla Plans to AI-ify Firefox
With a new CEO in control, Mozilla is doubling down on a strategy of trust, all the while leaning into AI.
-
Gnome Says No to AI-Generated Extensions
If you're a developer wanting to create a new Gnome extension, you'd best set aside that AI code generator, because the extension team will have none of that.
-
Parrot OS Switches to KDE Plasma Desktop
Yet another distro is making the move to the KDE Plasma desktop.
-
TUXEDO Announces Gemini 17
TUXEDO Computers has released the fourth generation of its Gemini laptop with plenty of updates.
-
Two New Distros Adopt Enlightenment
MX Moksha and AV Linux 25 join ranks with Bodhi Linux and embrace the Enlightenment desktop.
-
Solus Linux 4.8 Removes Python 2
Solus Linux 4.8 has been released with the latest Linux kernel, updated desktops, and a key removal.