Watching activity in the kernel with the bpftrace tool
Who Is Writing What?
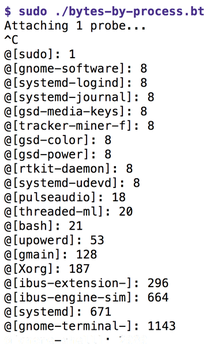
To find out which processes are writing the most data bytes to disk, Listing 4 attaches to the sys_exit_write tracepoint and uses the /args->ret > 0/ filter to limit probe activity to successful writes only.
Listing 4
bytes-by-process.bt
01 #!/usr/bin/bpftrace
02
03 tracepoint:syscalls:sys_exit_write
04   /args->ret > 0/
05 {
06   @[comm] = sum(args->ret)
07 }
The code construct in line 6 grabs the number of written bytes from args->ret, saves it to the unnamed map @ under the key for the process name, and uses sum() to process new values by adding them to previously existing ones.
By default, at the end of the program, bpftrace displays the content of all non-empty maps – in this case, after the user has pressed the Ctrl+C keyboard shortcut. This is why Figure 3 shows a map of all actively writing processes, as well as the number of bytes written. Alternatively, you could use an END block with print(@) to output the nameless map.
Slice by Slice
What about the average length of the data blocks being written? If you instructed bpftrace to log the length of each write operation in bytes, the result would be unreadable due to the sheer volume of individual data. In addition, each time bpftrace encounters a printf() statement, it has to wait until the slow terminal has absorbed the written text. This takes an eternity by kernel standards. To avoid slowing down the kernel too much, in this thrashing mode, the probes occasionally let an event pass without processing, notifying the user by a Skipped <xxx> events message. Fortunately, BPF provides statistical processing routines at the kernel level, such as hist() in Listing 5.
Listing 5
writes-by-size.bt
01 #!/usr/bin/bpftrace
02
03 tracepoint:syscalls:sys_exit_write
04   /args->ret > 0/
05 {
06   @ = hist(args->ret)
07 }
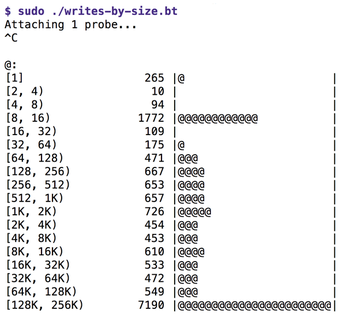
The hist() function assigns the individual byte sizes of tracked write events to buckets of increasing size and prints the Map type storing variable as a histogram at the end of the program. Figure 4 shows that the length of the written data blocks varies from 1 byte to 256KB, and that the most common block lengths are between 8 and 16 bytes and 128 and 256KB. On the far left, the ASCII diagram lists the size windows, from minimum to maximum size of the bucket. In the center, it shows the number of entries in the bucket; on the right, it shows the graphical animation of the counter.
Histograms of this kind are also suitable for displaying mean values and any outliers in time measurements, you could just as well track package run times over the network, bpftrace could instead determine the time delta between an enter-exit tracepoint pair by buffering the current nanosecond value in the nsecs variable when it occurs and by calculating the difference from the current nsecs value at the exit tracepoint.
The graphical representation can be used to determine whether Service Level Agreements were met or how often the set targets were missed. If you'd like to explore this some more, all variables and commands for bpftrace can be found in its documentation [4] and in a practical cheat sheet [5].
With bpftrace, there's a powerful new tool available for those who are running a fairly recent kernel and are not afraid of the project's lack of polish. Even as it is right now, it pretty much outshines everything that has been done before when it comes to quickly getting to the bottom of system-related bottlenecks on Linux servers. And it'll just keep getting better!
Infos
- "Measuring performance with the perf kernel tool" by Paul Menzel, Linux Magazine, issue 221, April 2019, p. 20-23, http://www.linux-magazine.com/Issues/2019/221/perf/
- Gregg, Brendan. BPF Performance Tools. Addison-Wesley, 2019, https://www.amazon.com/BPF-Performance-Tools-Brendan-Gregg/dp/0136554822
- Listings for the article: ftp://ftp.linux-magazine.com/pub/listings/linux-magazine.com/230/
- bpftrace Reference Guide: https://github.com/iovisor/bpftrace/blob/master/docs/reference_guide.md
- BPF Cheat Sheet: http://brendangregg.com/BPF/bpftrace-cheat-sheet.html
The Author

Mike Schilli works as a software engineer in the San Francisco Bay area, California. Each month in his column, which has been running since 1997, he researches practical applications of various programming languages. If you email him at mailto:mschilli@perlmeister.com he will gladly answer any questions.
« Previous 1 2 3
Buy this article as PDF
(incl. VAT)
Buy Linux Magazine
US / Canada
UK / Australia