Request Spotify dossiers and evaluate them with Go and R
Programming Snapshot – Go and R
Spotify, the Internet music service, collects data about its users and their taste in music. Mike Schilli requested a copy of his files to investigate them with Go.
Streaming services such as Spotify or Apple Music dominate the music industry. Their extensive catalogs now cover the entire spectrum of consumable music. Relying on artificial intelligence, these services introduce users to new songs they'll probably like, as predicted by the services' algorithms. Traditional physical music media no longer stand a chance against this and gather dust on the shelves. Of course, this development also means that anonymous music consumption is a thing of the past, because streaming services keep precise records of who played what track, when, and for how long.
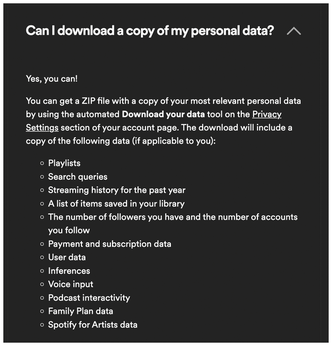
On request, Spotify will even hand over the acquired data (Figure 1). If you poke around a bit on their website, you'll find the buttons you need to press to request a copy of these files in Account | Privacy Settings, but Spotify takes their sweet time to respond. From the time of the request, it takes about a week for their archivist to retrieve the data from the files in the Spotify basement, compress them, and post them as a ZIP archive on the website for you to pick up. After receiving Spotify's email notification, you can then download the data for two weeks and poke around in it locally to your heart's content.
Exercise
The ZIP file containing the downloaded data includes a JSON file named StreamingHistory0.json
with the metadata of all the streams you played in historical order (Figure 2). In addition to the song and artist, the entries also list the start date and time and the playback duration. Playback duration is particularly interesting because if the user interrupts a stream after a few seconds and fast forwards to the next song, the track probably made it onto the playlist by mistake and was something the user didn't actually like. It will most likely turn out to be a false positive when it comes to putting together music suggestions.
As an exercise, Listing 1 shows a Go program that traverses the JSON data and creates charts featuring the most frequently played tracks. The top three output in Listing 2 shows you my favorite songs – minus the ones that I excluded because they were just too embarrassing to own up to.
Listing 1
stats.go
01 package main 02 import ( 03 "encoding/json" 04 "fmt" 05 "io/ioutil" 06 "sort" 07 ) 08 type stream struct { 09 EndTime string `json:endTime` 10 ArtistName string `json:artistName` 11 MsPlayed int64 `json:msPlayed` 12 TrackName string `json:trackName` 13 } 14 const jsonFile = "MyData/StreamingHistory0.json" 15 func main() { 16 bySong := map[string]int64{} 17 content, err := ioutil.ReadFile(jsonFile) 18 if err != nil { 19 panic(err) 20 } 21 data := []stream{} 22 err = json.Unmarshal(content, &data) 23 if err != nil { 24 panic(err) 25 } 26 for _, song := range data { 27 title := fmt.Sprintf("%s/%s", song.ArtistName, song.TrackName) 28 bySong[title] += 1 29 } 30 type kv struct { 31 Key string 32 Value int64 33 } 34 kvs := []kv{} 35 for k, v := range bySong { 36 kvs = append(kvs, kv{k, v}) 37 } 38 sort.Slice(kvs, func(i, j int) bool { 39 return kvs[i].Value > kvs[j].Value 40 }) 41 for i := 0; i < 3; i++ { 42 fmt.Printf("%s (%dx)\n", kvs[i].Key, kvs[i].Value) 43 } 44 }
Listing 2
Top Three Songs
Sparks/When Do I Get to Sing "My Way" - 2019 - Remaster (19x) Falco/The Sound of Music (16x) Linkin Park/With You (14x)
To do this, Listing 1 opens the JSON file in line 17 and returns a byte array with its content in the content
variable. Line 22 passes this to the Unmarshal
function from the json package in Go's standard library, along with a pointer to a stream
type structure defined previously in line 8. As you know, Go insists on strict type checking. In order for the JSON parser to create an internal Go data structure from the Spotify data, the format must be known and also match that of the actual JSON format.
The JSON blob provided by Spotify, as shown in Figure 2, consists of an array whose elements each correspond to a streamed track. The artist and track names are stored as strings in the artistName
and trackName
fields. msPlayed
gives you the playback time in milliseconds, while endTime
has the date and time at the end of playback.
The fields of the stream
structure in Listing 1 each start with a capital letter, which means that other packages can also access them later on. However, this means that the names are not identical to the variable names in JSON format, each of which starts with a lowercase letter. However, this is no big deal, because Go lets you give a structure a name that can differ from the field name with the json:
tag.
For example, ArtistName string `json:artistName`
in line 10 specifies that the artist in the ArtistName
field is of the string
type in the Go structure, and the name used for it in the incoming JSON is artistName
. This is all you need for json.Unmarshal()
to dig through all the entries in the JSON file in line 22, because the function has been passed a pointer to what is still an empty array of these stream
entries in data
. Using Go's reflection mechanism, the function figures out which JSON structures it needs to work its way through.
Listing 1 counts how many times each song occurs in the streaming history in the bySong
map defined in line 16. To do this, it uses the title's string as a key and increments the 64-bit integer map value by one for each playback event it finds in the streaming data. At the end, the function then needs to sort the map by the highest integer value in descending order to output the top three.
Sorting Is No Piece of Cake
In a scripting language, sorting the map data would be a snap, but Go offers type safety, and that's why Listing 1 converts the map entries into an array slice of kv
(for Key/Value) structures whose type it defines starting in line 30. The for
loop starting in line 35 then needs to slog through the entries of the map and append each key value pair it finds as a kv
struct to the kvs
array slice. The slice can then be sorted by Go's standard sort.Slice()
function. The callback in line 39 tells it that it can determine the desired order of two entries in the slice at positions i
and j
by a numeric comparison of the two counters at those positions.
Wow, that's pretty convoluted! At the end, the for
loop from line 41 goes through the sorted array, outputs the top positions, and terminates after the third value.
Faster with R
Go programs for parsing JSON data and computing statistics are a real pain. Go's type safety requires a disproportionate amount of boilerplate code here, which scripting languages just elegantly do without. This calls for a classic data wrangling language like R, which takes a more carefree approach, saving programmers a great deal of work. If you don't have R on your machine yet, simply install it on Ubuntu, for example, with:
sudo apt install r-base
Listing 3 shows a simple application that scans a user's Spotify streaming history, produces a histogram of the actual playing times of the songs they listened to, and displays it nicely as a bar graph (Figure 3). The diagram illustrates that many songs were simply canceled after less than 15 seconds (15,000 milliseconds). In this case, Spotify's suggestion algorithm most likely made a mistake, annoying the listener, who then switched to the next song. Starting at about one minute of playback time (i.e., after 60,000 milliseconds), an almost Gaussian-like bell curve appears, peaking at 220 seconds. Most songs these days are about three and a half minutes long, with the majority being between two and five minutes.
Listing 3
hist.r
01 #!/usr/bin/env Rscript 02 library("jsonlite") 03 jdata <- fromJSON("MyData/StreamingHistory0.json", simplifyDataFrame = TRUE) 04 jdata <- jdata[jdata$msPlayed < 300000, ] 05 attach(jdata) 06 png(filename="hist.png") 07 hist(msPlayed, main="Milliseconds Played") 10 detach(jdata)
To be able to call Listing 3 at the command line, the shebang statement in line 1 searches for the Rscript program in the shell's search paths and calls the underlying R interpreter with the program code from the listing. Also make sure to mark the file hist.r
(Listing 3) as executable via the chmod +x
command.
For an elegant approach to reading the JSON data, Listing 3 uses the jsonlite package; you will need to install this up front. After opening an R session (just type R
at the command line), the install.packages("jsonlite")
command loads the package's C++ sources from the Comprehensive R Archive Network (CRAN), compiles them locally, and integrates the library into the local R universe. After that, any R script can use library("jsonlite")
to include the new library and call functions from it.
Line 3 reads the JSON data from the streaming history using the fromJSON
function exported from jsonlite and stores it as a dataframe
in the jdata
variable. This R standard type is a kind of database table with row-by-row vector values, each spanning multiple columns. In addition to numeric values and character strings, the columns can also contain what are known as factors. In R, these factors are variables with a certain number of possible values, for example, small
, medium
, and large
.
Buy this article as PDF
(incl. VAT)