Map projection on a two-dimensional terminal with Go
Programming Snapshot – Go Map Projections

© Photo by Don Pinnock on Unsplash
While searching for a method to draw geodata right into the terminal, Mike Schilli discovers the wondrous world of map projections.
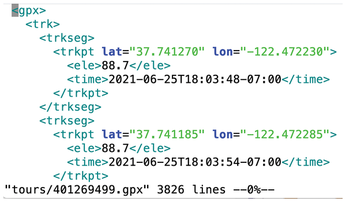
While I was working on hikefind, a command-line program that chooses a trail from a collection of GPX files with track points, for a recent issue [1], I got the idea of drawing the trail contours the program found in a terminal window. Unfortunately, a GPX file generated by an app such as Komoot or a Garmin tracker only contains geocoordinates as floating-point numbers. They refer to the points of the globe through which the trail passes (Figure 1).
These geopoints on a spherical surface now need to be converted to a two-dimensional coordinate system so that they look as natural as possible on a flat map. This problem was solved centuries ago. Any map, whether paper or digital, is based on the genius idea of projecting geopoints on the globe, which are available as latitude and longitude values, onto an XY coordinate system on a plane.
[...]
Buy this article as PDF
(incl. VAT)