Organize self-hosted services with Homepage
Adding Services
In essence, Homepage's functionality resides in the services it allows you to access. The default configuration adds three groups, each containing one service. You can find the YAML code for this configuration in the services.yaml file (Listing 4), defining a list of groups. Each group, in turn, specifies a list of services.
Listing 4
Default services.yaml File
01 - My First Group:
02   - My First Service:
03     href: http://localhost/
04     description: Homepage is awesome
05
06 - My Second Group:
07   - My Second Service:
08     href: http://localhost/
09     description: Homepage is the best
10
11 - My Third Group:
12   - My Third Service:
13     href: http://localhost/
14     description: Homepage is 'cool'
Now, I'll incorporate some custom services. For instance, you can create a Network group with links to the admin interfaces of your modem and access point(s) in services.yaml, as detailed in Listing 5. Each service represents an item in the group's list, featuring key/value pairs that include href for the service URL, description for an optional description displayed underneath the name, and icon for an optional icon shown before the name.
Listing 5
Network Group with Links
01 - Network:
02   - Proximus:
03       href: http://192.168.1.1
04       description: Modem
05       icon: mdi-web
06   - OpenWrt:
07       href: http://gl-mt3000.home
08       description: Access point
09       icon: openwrt
The icon property can either be an absolute URL or a name from Dashboard Icons [13], a collection of icons for various web applications and online services. It's also possible to use prefixed icon names from Material Design Icons [14] using mdi-XX, from Simple Icons [15] using si-XX, and from selfh.st's self-hosted dashboard icons [16] using sh-XX.
Groups themselves can receive an icon, too, appearing before their names. To achieve this, modifications should occur in another file, settings.yaml (see Listing 6).
Listing 6
Assigning Icons to Service Groups
01 layout:
02   Network:
03     icon: mdi-lan-connect
04   Infrastructure:
05     icon: mdi-server-network
06   Services:
07     icon: mdi-apps
Service Widgets
Up to this point, my dashboard links are just glorified bookmarks. However, Homepage also supports service widgets [17] for numerous services. See the list on Homepage's website to verify whether your preferred services are supported. For instance, for the OPNsense [18] router operating system, the widget in Listing 7 (added to settings.yaml) shows the router's CPU load, used RAM, and WAN upload and download values. If you want to see only specific fields, just add a property like fields: ["wanDownload", "wanUpload"].
Listing 7
A Service Widget for OPNsense
01 - OPNsense:
02     href: https://opnsense.home
03     description: Router
04     icon: opnsense
05     widget:
06       type: opnsense
07       url: https://opnsense.home
08       username: KEY
09       password: SECRET
In the username and password fields, enter the API key and secret created within OPNSense's web interface under System | Access | Users. Homepage's OPNsense widget documentation page offers further details.
A service can have multiple widgets, which proves useful when using a monitoring tool such as Uptime Kuma [19]. To do this, you add the OPNsense widget to the OPNsense service to show some service-specific details as well as the Uptime Kuma widget for uptime checks. Instead of a single widget object, the service then has a widgets object in service.yaml representing a list of both widgets as shown in Listing 8.
Listing 8
A Service with Multiple Widgets
01 - OPNsense:
02     href: https://opnsense.home
03     description: Router
04     icon: opnsense
05     widgets:
06       - type: opnsense
07         url: https://opnsense.home
08         username: KEY
09         password: SECRET
10       - type: uptimekuma
11         url: https://uptime-kuma.rubus.home
12         slug: router
13         fields: ["uptime", "incident"]
The Uptime Kuma widget uses data from a status page, so you need to create this status page monitoring your router's uptime and then enter its name as the value for the slug key within the widget. For instance, if the status page is https://uptime-kuma.rubus.home/status/router, the slug to enter here would be router.
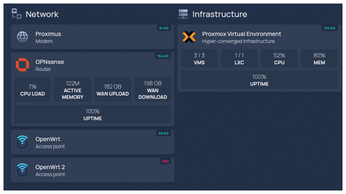
Services may also incorporate an optional ping or siteMonitor property to monitor their availability. With ping: opnsense.home, Homepage regularly sends an ICMP echo (ping) packet to the host and shows its availability in the upper-right corner of the service box. With siteMonitor: https://opnsense.home, Homepage performs an HTTP HEAD request to the URL to indicate whether the web page is online. The status style can be changed in settings.yaml with statusStyle: dot or statusStyle: basic. Once configured, the dashboard now resembles Figure 3.
Integrating Docker Containers
For services running in Docker or Podman containers, Homepage seamlessly integrates with the container engine, for example, to display statistics and enable automatic service discovery if the containers have the proper labels. But first, Homepage needs to have a Docker instance [20] configured in its docker.yaml file. You can let Homepage connect to the Docker socket like this:
local-docker:
  socket: /var/run/docker.sock
In your Docker Compose file, mount this socket into the Homepage container with a volume definition:
volumes:
  - /home/koan/containers/homepage:/app/config
  - /var/run/docker.sock:/var/run/docker.sock
Then recreate the container.
Using the Docker socket directly requires Homepage to run as root. If you prefer rootless containers (e.g., with Podman), you can let Docker Socket Proxy [21] expose the Docker socket over an HTTP API with restricted permissions. To do this, add the Docker Socket Proxy service to your Docker Compose file, as shown in Listing 9. The container mounts the Docker socket, with environment variables granting or revoking access to specific Docker API parts. By default, Docker Socket Proxy only allows GET and HEAD operations, meaning any API call is read-only. Using the environment variable CONTAINERS=1 will grant access to expose information about containers, which is the only thing that Homepage needs.
Listing 9
Docker Socket Proxy
01 docker-socket-proxy:
02   image: ghcr.io/tecnativa/docker-socket-proxy:0.3.0
03   container_name: docker-socket-proxy
04   volumes:
05     - /var/run/docker.sock:/var/run/docker.sock:ro
06   environment:
07     CONTAINERS: 1
08   restart: unless-stopped
After doing this, the Homepage container no longer needs the Docker socket in its volumes. The docker.yaml file should refer to TCP port 2375 of the Docker Socket Proxy's container:
local-docker:
  host: docker-socket-proxy
  port: 2375
The host is the container's hostname, which Homepage can access because both containers reside within the same network created by Docker Compose. Now (re)create both containers:
$ docker-compose down
$ docker-compose up -d
Once you have the other services running as Docker containers from the same Docker Compose file, you can add references to the Docker server (local-docker) and the container name in the service in services.yaml, as illustrated in Listing 10. The server value refers to the Docker instance you defined in Homepage's docker.yaml, and the container value refers to FreshRSS's container_name in your Docker Compose file.
Listing 10
Service with Docker Information
01 - Services:
02   - FreshRSS:
03       href: http://debian.home:8081
04       description: Feed aggregator
05       icon: freshrss
06       server: local-docker
07       container: freshrss
Upon reloading Homepage, the FreshRSS service in your Services receives the status RUNNING in the top-right corner or EXITED when the container has stopped. If you click on the status, the service box expands to show some container statistics, which include CPU and memory usage as well as network traffic received and transmitted.
« Previous 1 2 3 Next »
Buy this article as PDF
(incl. VAT)
Buy Linux Magazine
US / Canada
UK / Australia