Using Go to Monitor for Available Laundromat Machines

Programming Snapshot – Go Monitoring

© Photo by Annie Spratt on Unsplash
Before doing his laundry, Mike Schilli checks the activity in the laundry room using a Go program that queries a Tapo motion detector.
Anyone who lives in an American apartment building like I do is likely to experience a thousand adventures every day. One of them takes place in the building's small laundry room, where nearly 30 occupants share two washing machines. I don't know how many times I have taken the elevator two floors down with a bulging laundry basket in tow, only to find that both machines are occupied, leading me to shout "This is a job for the German engineer in the house!" (Figure 1). In response, I built a system that now displays all the activities in the laundry room for everyone to view on the web.
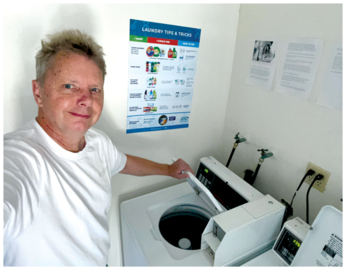
To do this, I first glued two battery-powered Tapo T100 motion detectors to the walls of the laundry room (Figure 2); these devices are triggered by passing human bodies, as their infrared radiation changes the heat background measured by a passive infrared sensor (PIR). The sensors then send a short signal to a Tapo H100 hub, whose controller stores the timestamps of the events in an SQLite database.
[...]
Buy this article as PDF
(incl. VAT)