Workflow-based data analysis with KNIME
Opening a Connection
The next step is to relate the imported data to each other. If you are familiar with databases, you know that the best way to do this is with a join. A join consists of one or more predicates that determine which rows belong together in two tables. The rows that belong together are then combined in an output table.
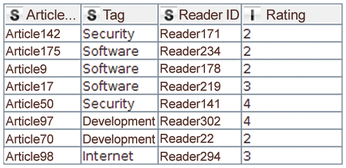
This example needs to combine the two tables based on the article ID. In this case, the join predicate determines that ratings for an article must be linked to the categories to which the same article is assigned. The node that KNIME uses for this is Joiner. Its output table is shown in Figure 4. Like its database counterpart, Joiner supports various modes, including inner, outer, left, and right joins. The user can also select which columns are to be copied from which table into the output.
Pivoting
The next step is to create a kind of fingerprint for each reader, describing the reader's preferences by calculating the reader's average rating for the articles in each section.
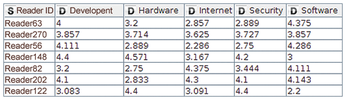
The result is a table in which each reader becomes a row and each category becomes a column. The cells of the intersection points display the reader's average rating for articles in each category (Figure 5).
This transformation is handled by the pivot node. The pivot node dialog may prove intimidating at first glance, since it requires information on the group, pivot, and aggregation columns in three separate tabs. The values in the group columns determine which rows need to be combined into a single row – that is, all those that have the same values in these columns. For the sample workflow, the reader ID is a group column, the category is the pivot column, and the aggregation column contains the ratings that an average function averages.
If a reader has not rated a single article for a category, the cell in the pivotized table does not contain a value. KNIME indicates this with a red question mark. You can replace missing values using the Missing Value node. In the example, it makes sense to assume that the reader does not like a category in which they have never rated an article. Instead of the missing value, the table will use a zero.
It is often the case that a node produces a table with long or incomprehensible column names. For example, the pivot node from the previous category creates columns in the format "Category + Rating." The suffix, which is the same in each column, is not important. Two important KNIME nodes assist with renaming columns. Column Rename lets you rename each column name explicitly; Column Rename (Regex) lets you change the column names using regular expressions.
Cluster Analysis
Now that the data is transformed into a workable format, you can begin to group readers according to their preferences. Readers with similar preferences should end up in the same group. Cluster analysis is a useful technique for this kind of problem, and KNIME has different nodes to support it, including k-means, fuzzy c-means, hierarchical agglomerative clustering, or k-medoids.
What all these cluster algorithms have in common is that users have to decide for themselves how many groups they want to receive. They also all need a way to calculate the similarity between two datapoints. In the previous category, a table row was created for each reader, containing five numeric values – one for each category.
The workflow for the example uses the k-means node, which is quite fast and generally produces good results. The algorithm works with different distance measurements – in KNIME it is implemented with the Euclidean distance (see the "Computing the Distance" box). The k-means node in KNIME, which executes the algorithm, appends another column to the input table that remembers the group in which the datapoint lies.
Computing the Distance
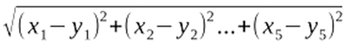
Let each reader be a five-component vector consisting of the ratings in the five categories. The following formula then computes the distance between the two readers x and y:
The k-means algorithm initiates the following steps to find homogeneous groups:
1. Initialize the cluster centers with random datapoints.
2. Compute the nearest cluster center for each datapoint.
3. Compute the center for each group of datapoints assigned to a center in Step 2.
4. Update the cluster centers with the newly found centers.
5. If the centers remain unchanged, stop the computations; otherwise go to step 2.
Cluster analysis reveals that readers who give a high rating to articles in the categories Hardware and Security usually lie in cluster 0, while readers from cluster 1 prefer the categories Internet and Software, and cluster 2 prefers Development and Software. Once you know the results, it is possible to give the clusters meaningful names. Due to their preferences, for example, readers in Cluster 0 can be addressed as administrators, those in Cluster 1 as power users, and those in Cluster 2 as developers. These new names are added using the Cell Replacer node.
« Previous 1 2 3 4 Next »
Buy Linux Magazine
US / Canada
UK / Australia
Subscribe to our Linux Newsletters
Find Linux and Open Source Jobs
Subscribe to our ADMIN Newsletters
Support Our Work
Linux Magazine content is made possible with support from readers like you. Please consider contributing when you’ve found an article to be beneficial.

News
-
Canonical Releases Ubuntu 24.04
After a brief pause because of the XZ vulnerability, Ubuntu 24.04 is now available for install.
-
Linux Servers Targeted by Akira Ransomware
A group of bad actors who have already extorted $42 million have their sights set on the Linux platform.
-
TUXEDO Computers Unveils Linux Laptop Featuring AMD Ryzen CPU
This latest release is the first laptop to include the new CPU from Ryzen and Linux preinstalled.
-
XZ Gets the All-Clear
The back door xz vulnerability has been officially reverted for Fedora 40 and versions 38 and 39 were never affected.
-
Canonical Collaborates with Qualcomm on New Venture
This new joint effort is geared toward bringing Ubuntu and Ubuntu Core to Qualcomm-powered devices.
-
Kodi 21.0 Open-Source Entertainment Hub Released
After a year of development, the award-winning Kodi cross-platform, media center software is now available with many new additions and improvements.
-
Linux Usage Increases in Two Key Areas
If market share is your thing, you'll be happy to know that Linux is on the rise in two areas that, if they keep climbing, could have serious meaning for Linux's future.
-
Vulnerability Discovered in xz Libraries
An urgent alert for Fedora 40 has been posted and users should pay attention.
-
Canonical Bumps LTS Support to 12 years
If you're worried that your Ubuntu LTS release won't be supported long enough to last, Canonical has a surprise for you in the form of 12 years of security coverage.
-
Fedora 40 Beta Released Soon
With the official release of Fedora 40 coming in April, it's almost time to download the beta and see what's new.