Creating your own custom maps
Other Ways to Find and Map Places
Figure 5 shows another map that I created by just copying, and executing without any change, another code sample found on the prettymaps homepage. I am including it here because, besides showing how different these maps can be from each other at the purely visual level, it uses another OSM feature that is worth knowing. The map shows the Lagoa dos Patos in Brazil, and Listing 2 shows the relevant parts of the prettymaps script that generates it.

Listing 2
Finding Places by Their OSM Identifier
01  fig, ax = plt.subplots(figsize = (10, 12), constrained_layout = True)
02
03  def postprocessing(layers):
04  layers['perimeter'] = layers['perimeter'].buffer(2000)
05  return layers
06
07  layers = plot(
08  'R2709093',
09   ...
10  postprocessing = postprocessing,
11
12  drawing_kwargs = {
13  'perimeter': {'fill': False, 'ec': '#6da8c2', 'lw': 2, 'zorder': 3},
14  },
15
16  osm_credit = {'x': -.08, 'y': .02, 'color': '#2F3737'}
17  )
18
19  # Set bounds
20  xmin, xmax = ax.get_xlim()
21  ymin, ymax = ax.get_ylim()
22  dx, dy = xmax-xmin, ymax-ymin
23  ax.set_xlim(xmin+.15*dx, xmax-.15*dx)
24  ax.set_ylim(ymin+.0*dy, ymax-.0*dy)
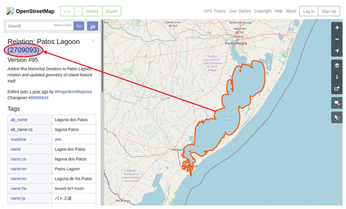
Figure 6 is what the same lagoon looks like inside OpenStreetMap, plus the unique numeric identifier. Inside the OSM database, each "object" has a unique numeric identifier that is visible in the online map when you select that object. As you can see comparing Figure 6 with line 8 of Listing 2, you can use that identifier to directly define places in prettymaps! This capability may be very useful if you start using prettymaps to generate many maps of many places, maybe fetching their identifiers with some other script.
Other relevant parts of Listing 2 are lines 4 and 13, which process the perimeter of the map in a different way than Listing 1, and the final six lines, which set the borders of the drawing to make sure that no part of the lagoon is cut off the map. To see in detail how those instruction work, download that example and try to change the numeric constants in lines 23 and 24.
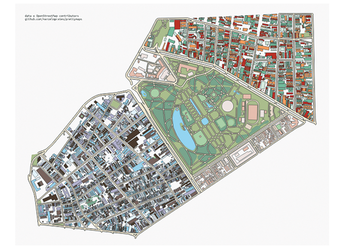
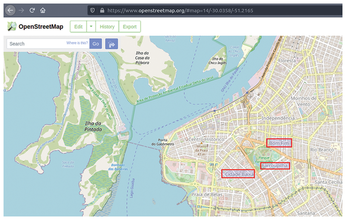
As final proof of the great versatility of prettymaps, check out Figure 7, which was generated from another code sample found on the website. Figure 7 shows a map of three adjacent neighborhoods of the city of Porto Alegre, Brazil (Figure 8), and nothing else. What's more, each neighborhood is painted with different colors.
The code excerpt in Listing 3 shows how to obtain this result. To begin with, you must define a hash, an associative array in which each element is associated with a key. In Listing 3, that hash is called places (lines 4 to 8). Each line of that array is about one of the places that should be drawn. More specifically, each line defines a list of colors, in the same format described before, associated with a key that is the name of a neighborhood to fetch from OpenStreetMap and then draw. Then, you must wrap the same calls to the plot and drawing_kwargs functions of the previous example in one loop (line 10) that handles one neighborhood at a time. This happens because every iteration of that loop loads one key from the places array, calling it place, and loads the corresponding list of colors into an auxiliary variable called palette. Then, as you can see in lines 12 and 17, each call to plot and drawing_kwargs uses the place name and colors that are currently loaded into those two variables. The autoscale function in the last line ensures, with a different method than that used by Listing 2, that the whole drawing will fit in the image.
Listing 3
Mapping Adjacent Places in Different Styles
01 fig, ax = plt.subplots(figsize = (15, 12), constrained_layout = True)
02 fig.patch.set_facecolor('#F9F8F8')
03
04 places = {
05 - 'Farroupilha, Porto Alegre': ['#EEE4E1', '#E7D8C9', '#E6BEAE'],
06 - 'Cidade Baixa, Porto Alegre': ['#49392C', '#77625C', '#B2B1CF', '#E1F2FE', '#98D2EB'],
07 - 'Bom Fim, Porto Alegre': ['#BA2D0B', '#D5F2E3', '#73BA9B', '#F79D5C'],
08 }
09
10 for i, (place, palette) in enumerate(places.items()):
11 plot(
12 place,
13 ...
14 drawing_kwargs = {
15   'perimeter': {'fill': False, 'lw': 0, 'zorder': 0},
16   'streets': {'fc': '#F1E6D0', 'ec': '#2F3737', 'lw': 1.5, 'zorder': 3},
17   'building': {'palette': palette, 'ec': '#2F3737', 'lw': 1, 'zorder': 4},
18 },
19
20 )
21
22 ax.autoscale()
Try prettymaps!
The examples I have presented are enough to generate thousands of maps, each with a distinct style, with very little effort once you have installed prettymaps and all its dependencies. What's more, you may use Matplotlib's capabilities to add both captions [13] and generic images [14] to all your maps, for any conceivable purpose. It would then be quite easy, for example, to create infographics that show different maps, each associated to charts generated from some statistical data about the same area. Isn't free software wonderful?
Infos
- OpenStreetMap: https://openstreetmap.org
- Stop at Zona-M blog: https://stop.zona-m.net/tag/openstreetmap/
- prettymaps: https://github.com/marceloprates/prettymaps
- prettymaps examples for Jupyter Notebook: https://nbviewer.org/github/marceloprates/prettymaps/blob/main/notebooks/examples.ipynb
- More examples on GitHub: https://github.com/zaataylor/maps
- OSMnx: https://github.com/gboeing/osmnx
- Shapely: https://pypi.org/project/Shapely/
- vsketch: https://github.com/abey79/vsketch
- Matplotlib: https://matplotlib.org/
- IPython: https://ipython.org/
- prettymaps subreddit: http://www.reddit.com/r/prettymaps_/
- Online color picker: http://www.w3schools.com/colors/colors_picker.asp
- Adding captions in Matplotlib: https://matplotlib.org/stable/tutorials/text/text_intro.html
- Adding generic images in Matplotlib: https://stackoverflow.com/questions/3609585/how-to-insert-a-small-image-on-the-corner-of-a-plot-with-matplotlib
The Author
Marco Fioretti (http://mfioretti.com) is a freelance author, trainer, and researcher based in Rome, Italy. He has been working with free/open source software since 1995 and on open digital standards since 2005. Marco also is a Board Member of the Free Knowledge Institute (http://freeknowledge.eu), and blogs about digital rights at https://stop.zona-m.net.

« Previous 1 2 3
Buy this article as PDF
(incl. VAT)
Buy Linux Magazine
US / Canada
UK / Australia
Subscribe to our Linux Newsletters
Find Linux and Open Source Jobs
Subscribe to our ADMIN Newsletters
Support Our Work
Linux Magazine content is made possible with support from readers like you. Please consider contributing when you’ve found an article to be beneficial.

News
-
Endless OS 6 has Arrived
After more than a year since the last update, the latest release of Endless OS is now available for general usage.
-
Fedora Asahi 40 Remix Available for Macs with Apple Silicon
If you've been anticipating KDE's Plasma 6 for your Apple Silicon-powered Mac, then you're in luck.
-
Red Hat Adds New Deployment Option for Enterprise Linux Platforms
Red Hat has re-imagined enterprise Linux for an AI future with Image Mode.
-
OSJH and LPI Release 2024 Open Source Pros Job Survey Results
See what open source professionals look for in a new role.
-
Proton 9.0-1 Released to Improve Gaming with Steam
The latest release of Proton 9 adds several improvements and fixes an issue that has been problematic for Linux users.
-
So Long Neofetch and Thanks for the Info
Today is a day that every Linux user who enjoys bragging about their system(s) will mourn, as Neofetch has come to an end.
-
Ubuntu 24.04 Comes with a “Flaw"
If you're thinking you might want to upgrade from your current Ubuntu release to the latest, there's something you might want to consider before doing so.
-
Canonical Releases Ubuntu 24.04
After a brief pause because of the XZ vulnerability, Ubuntu 24.04 is now available for install.
-
Linux Servers Targeted by Akira Ransomware
A group of bad actors who have already extorted $42 million have their sights set on the Linux platform.
-
TUXEDO Computers Unveils Linux Laptop Featuring AMD Ryzen CPU
This latest release is the first laptop to include the new CPU from Ryzen and Linux preinstalled.