Using Python in the browser
PyScript with JavaScript Libraries
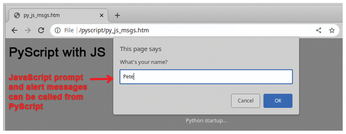
In many cases you'll want to use JavaScript libraries along with PyScript. For example, you might want to include JavaScript prompts or alert messages for your page. To access a JavaScript library, add the line:
from js import some_library
Listing 3 shows the code to import the alert and prompt libraries, then prompts the user for their name, and finally displays an alert message with the entered name (Figure 6).
Listing 3
JavaScript Libraries with PyScript
<py-script>
  # Use a JS library to show a prompt and alert message
  from js import alert, prompt
  # Ask your name, then show it back
  name = prompt("What's your name?", "Anonymous")
  alert(f"Hi:, {name}!")
</py-script>
Reading and Plotting a Local CSV File
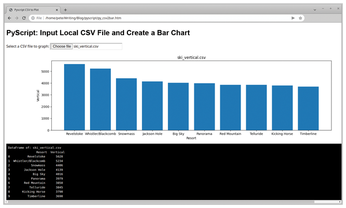
For a final, more challenging example, I'll use PyScript to read a local CSV file into a pandas dataframe and then use Matplotlib to plot a bar chart (Figure 7).
For security reasons, web browsers cannot access local files without the user's authorization. To allow PyScript to access a local file, you need to do three key things. To start, you need to configure a page with an <input type="file"> tag. To call a file-picker dialog with a CSV filter, enter:
<input type="file" id="myfile" name="myfile" accept=".csv">
Next, you must define an event listener to catch a change in the <input> file. For this step, two libraries need to be imported, and an event listener needs to be configured as shown in Listing 4.
Listing 4
Defining an Event Listener
from js import document
from pyodide.ffi.wrappers import add_event_listener
# Set the listener to look for a file name change
e = document.getElementById("myfile")
add_event_listener(e, "change", process_file)
Finally, you need to import the JavaScript FileReader and the PyScript asyncio libraries as follows:
from js import FileReader
import asyncio
The FileReader object is used to read in the CSV file's content. The asyncio library creates background event processing to allow functions to complete successfully without timing or delay issues.
Listing 5 shows the full code for reading and plotting a local CSV file. In Listing 5, pay particular attention to:
- defining a
<py-config>section for the pandas and Matplotlib (PyPI) libraries (lines 9-11) and - creating an
asyncfunction (process_file(event)).
Note, the async function is launched from the add_event_listener (line 51) when the user selects a file.
Listing 5
PyScript CSV File to Bar Chart
01 <!DOCTYPE html>
02 <html lang="en">
03   <head>
04     <title>Pyscript CSV to Plot</title>
05     <link rel="stylesheet" href="https://pyscript.net/latest/pyscript.css" />
06     <script defer src="https://pyscript.net/latest/pyscript.js"></script>
07     <title>Local CSV File to Matplotlib Chart</title>
08     <!-- Include the Pandas and Matplotlib packages -->
09     <py-config>
10       packages = [ "pandas", "matplotlib" ]
11     </py-config>
12   </head>
13   <body>
14
15     <h1>Pyscript: Input Local CSV File and Create a Bar Chart</h1>
16     <label for="myfile">Select a CSV file to graph:</label>
17     <input type="file" id="myfile" name="myfile" accept=".csv"><br>
18
19     <div id="lineplot"> </div>
20     <pre id="print_output"> </pre>
21     <py-script output="print_output">
22 import pandas as pd
23 import matplotlib.pyplot as plt
24 from io import StringIO
25 import asyncio
26 from js import document, FileReader
27 from pyodide.ffi.wrappers import add_event_listener
28
29 # Process a new user selected CSV file
30 async def process_file(event):
31     fileList = event.target.files.to_py()
32     for f in fileList:
33         data = await f.text()
34         # the CSV file is read as large string
35         # use StringIO to pass info into Panda dataframe
36         csvdata = StringIO(data)
37         df = pd.DataFrame(pd.read_csv(csvdata, sep=","))
38         print("DataFrame of:", f.name, "\n",df)
39
40         # create a Matplotlib figure with headings and labels
41         fig, ax = plt.subplots(figsize=(16,4))
42         plt.bar(df.iloc[:,0], df.iloc[:,1])
43         plt.title(f.name)
44         plt.ylabel(df.columns[1])
45         plt.xlabel(df.columns[0])
46         # Write Mathplot figure to div tag
47         pyscript.write('lineplot',fig)
48
49 # Set the listener to look for a file name change
50 e = document.getElementById("myfile")
51 add_event_listener(e, "change", process_file)
52
53 </py-script>
54 </body>
55 </html>
The CSV file is read into a variable (line 34), and then the StringIO function allows the data to be passed into a pandas dataframe (lines 36 and 37). Line 38 outputs the dataframe to a py-terminal element:
print("DataFrame of:", f.name, "\n",df)This example only presents bar charts for the first two rows of data (lines 42-45), but the code would be modified to do line plots for multiple rows of data. Line 47 sends the Matplotlib figure to the page's <div id="lineplot"> element:
pyscript.write('lineplot',fig)Although somewhat complex, this example only took 30 lines of Python code. Good future projects could include adding options for sorting, grouping, and customized plots. It's important to note that PyScript can also be used to save files to a local machine.
Summary
Using Python libraries such as pandas, SymPy, or Matplotlib on a client page can be a very useful feature. It's also nice that these PyScript pages don't require Python on the client machine.
While working with PyScript, I found two issues. The call-up is very slow (especially compared to Brython pages). In addition, I often got tripped up with Python indentation when I was cutting and pasting code. Overall, however, I was very impressed with PyScript, and I look forward to seeing where the project goes.
Infos
- Brython: https://brython.info/
- PyScript: https://pyscript.net/
« Previous 1 2
Buy this article as PDF
(incl. VAT)
Buy Linux Magazine
US / Canada
UK / Australia
Subscribe to our Linux Newsletters
Find Linux and Open Source Jobs
Subscribe to our ADMIN Newsletters
Support Our Work
Linux Magazine content is made possible with support from readers like you. Please consider contributing when you’ve found an article to be beneficial.

News
-
OSJH and LPI Release 2024 Open Source Pros Job Survey Results
See what open source professionals look for in a new role.
-
Proton 9.0-1 Released to Improve Gaming with Steam
The latest release of Proton 9 adds several improvements and fixes an issue that has been problematic for Linux users.
-
So Long Neofetch and Thanks for the Info
Today is a day that every Linux user who enjoys bragging about their system(s) will mourn, as Neofetch has come to an end.
-
Ubuntu 24.04 Comes with a “Flaw"
If you're thinking you might want to upgrade from your current Ubuntu release to the latest, there's something you might want to consider before doing so.
-
Canonical Releases Ubuntu 24.04
After a brief pause because of the XZ vulnerability, Ubuntu 24.04 is now available for install.
-
Linux Servers Targeted by Akira Ransomware
A group of bad actors who have already extorted $42 million have their sights set on the Linux platform.
-
TUXEDO Computers Unveils Linux Laptop Featuring AMD Ryzen CPU
This latest release is the first laptop to include the new CPU from Ryzen and Linux preinstalled.
-
XZ Gets the All-Clear
The back door xz vulnerability has been officially reverted for Fedora 40 and versions 38 and 39 were never affected.
-
Canonical Collaborates with Qualcomm on New Venture
This new joint effort is geared toward bringing Ubuntu and Ubuntu Core to Qualcomm-powered devices.
-
Kodi 21.0 Open-Source Entertainment Hub Released
After a year of development, the award-winning Kodi cross-platform, media center software is now available with many new additions and improvements.