Calculating Probability

Perl – Think Again

Article from Issue 165/2014
Author(s):

To tackle mathematical problems with conditional probabilities, math buffs rely on Bayes' formula or discrete distributions, generated by short Perl scripts.

Features

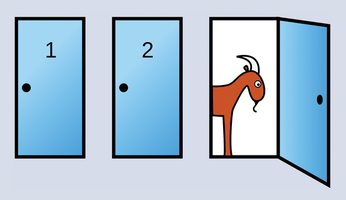
The Monty Hall problem is loved by statisticians around the world [1]. You might be familiar with this puzzle, in which a game show host offers a contestant a choice of three doors – behind one door is a prize, but the other two doors only reveal goats. After the contestant chooses a door, the TV host opens a different door, revealing a goat, and asks the candidate to reconsider (Figure 1). Who would have thought that probabilities in a static television studio could change so dramatically just because the host opens a door without a prize?

Figure 1: Hoping to win the car, the contestant chooses door 1. The host, who knows which door leads to the car, then opens door 3, revealing a goat. He offers the contestant the option of picking another door. Does it make sense for the contestant to change their mind and go for door 2? (Source: Wikipedia)

The human brain seems to struggle with conditional probabilities like these, which describe random events with preconditions. It's just like a task I set up in a Perl column 15 years ago, which involved a top hat with three cards inside. The first card is black on both the front and back, the second card is red on front and back, and the third card red on one side and black on the other (Figure 2). One card is drawn. You can see the front, which is red. What is the probability of the back of the card also being red?

Figure 2: A test candidate draws a card from a top hat with one black-and-red, one black-and-black, and one red-and-red card.

Counterintuitive

Most people immediately respond "50 percent," because there are apparently two equally probable cases: the red-and-black card and the red-and-red card – that is, the opposite side is black in one case and red in the other case. To many people's surprise, however, the correct answer is "66 percent." The clue lies within the preconditions of the experiment: The red-and-red card is drawn twice as often in comparison to the red-and-black one, because it meets the precondition of the experiment – one side is red – on both sides, whereas the red-and-black card only gets drawn one-third of the time.

More than 250 years ago, the mathematician Thomas Bayes tried to express such intuitively error-prone problems in an immutable formula. The Bayes' theorem [2] describes in its "diachronic interpretation" how the probabilities of hypotheses change over time, as you encounter new data in an experiment. The formula

P(H|D) = P(H) × P(D|H)/P(D)

defines the probability P of a hypothesis H, for example, "I have drawn the red-and-red card," under the condition of newly emerging data D, such as "The front of the drawn card is red" (Figure  3).

Figure 3: Bayes' theorem defines the probability of a hypothesis in response to newly emerging data. (Source: Translated from German Wikipedia)

On the right-hand side of the equation you see P(H), the probability of the hypothesis, before new data become available. Bayes multiplies it by P(D|H), that is, the probability that the data are available under the hypothesis. How likely is it, for example, that the person drawing the cards actually will see a red front if they have drawn the red-and-red card?

The denominator on the right side, P(D), is the probability of the available data, independent of any hypothesis. How likely is it that the candidate will see a red front after drawing any card?

Clever Bayes

All three possible hypotheses – randomly drawn cards – are obviously equally likely in this experiment. In other words, P(H) – the probability that the red-red card is drawn – is equal to 1/3, because it is drawn in one third of all cases. Assuming this hypothesis, the flip side of the drawn red-red card is trivially also red in exactly 100 percent of all cases; that is, P(D|H) = 1.

Regardless of the hypothesis of one drawn card, the probability of seeing a red card surface after drawing is 50 percent, that is, P(D) = 1/2. After all, there are six card sides in the hat, three of which are red, and three black. If you substitute this into the Bayesian formula, the result for P(H|D) is thus 1/3 × 1/(1/2) = 2/3. Thus, the formula predicts the experimentally demonstrable correct result of 66 percent and contradicts our intuition.

Probability, Discretely Programmed

Think Bayes [3], which was published about six months ago, not only explains the Bayesian formula but also describes a numerical method that is easy to use for experiments with short software programs. To do this, you store the hypotheses as statistical distributions, that is, in a Python dictionary or Perl hash, along with their probabilities.

As additional data becomes available, the stored values are then multiplied by the conditional probability of the incoming data, under the assumption that the individual hypothesis is true. Later, the program normalizes all values so that they add up to 1, or 100 percent.

The result is the probability of all hypotheses in the light of the incoming data. This process and specifically the final normalizing step can only be used, however, if:

  • not more than one of the hypotheses is true, and
  • there are no other options; that is, at least one of the hypotheses is true.

Listing 1 [4] shows the implementation of the cards script, which prints the correct solution, 0.666. It uses the Distrib.pm module (Listing 2), which provides auxiliary functions for computing the statistical distribution. The probabilities for the hypotheses of drawing different cards (BB, BR, RR for black-black, black-red, red-red) are fed to the module in lines 7-9, each with a value of 1/3.

Listing 2

Distrib.pm


Listing 1

cards


Lines 11-13 of Listing 1 define the incoming data (i.e., the probabilities that the front sides of the drawn cards are red) for each hypothesis and multiply the supplied hypothesis values by them. Thus, the probability of the subject seeing a red front on the black-black card is zero. The probability is 50 percent for the black-red card, depending on which way the card faces coming out of the hat. The red-red card shows red in 100 percent of all cases, which is why line 13 sets the multiplier to a value of 1.

Finally, the call to the prob("RR") method returns the normalized probability of the hypothesis red-red card, which is 2/3.

Buy this article as PDF

Express-Checkout as PDF
Price $2.95
(incl. VAT)

Buy Linux Magazine

SINGLE ISSUES
 
SUBSCRIPTIONS
 
TABLET & SMARTPHONE APPS
Get it on Google Play

US / Canada

Get it on Google Play

UK / Australia

Related content

  • DIY Scoreboard

    We look at a broadcast video system network that uses Python code to control a video router and check out another program that creates a scoreboard.

  • CardStock

    CardStock provides a simple development environment for building a Python graphical application.

  • ReportLab and Panda3D

    A game of bingo illustrates how to use the ReportLab toolkit and Panda3D real-time 3D engine.

  • recordMyDesktop

    A training video of a new application can really reduce the learning curve. The recordMyDesktop program is at an early stage of development but already stable enough for everyday use. We'll show you how to use the program to capture custom procedures in a desktop video.

  • Support System

    Contrary to popular belief, free software does offer support. Depending on the distro, this support can be found in a wide range of documentation formats. Here's what to expect from a sampling of distros.

comments powered by Disqus
Subscribe to our Linux Newsletters
Find Linux and Open Source Jobs
Subscribe to our ADMIN Newsletters

Support Our Work

Linux Magazine content is made possible with support from readers like you. Please consider contributing when you’ve found an article to be beneficial.

Learn More

News