Getting started with the ELK Stack monitoring solution

Elk Hunting

© Photo by David Santoyo on Unsplash

© Photo by David Santoyo on Unsplash

Article from Issue 245/2021
Author(s):

ELK Stack is a powerful monitoring system known for efficient log management and versatile visualization. This hands-on workshop will help you take your first steps with setting up your own ELK Stack monitoring solution.

Today's networks require a monitoring solution with industrial-strength log management and analytics. One option that has gained popularity in recent years is ELK stack [1]. The free and open source ELK Stack collection is maintained by a company called Elastic. (According to the website, the company has recently changed the name of the project to Elastic Stack, but the previous name is still in common usage.) ELK Stack is not a single tool but a collection of tools (Figure 1). The ELK acronym highlights the importance of the collection's three most important utilities. At the heart of the stack, Elasticsearch collects and maintains data, providing an engine, based on Apache Lucene, for searching through it. Logstash serves as the log processing pipeline, collecting data from a multitude of sources, transforming it, then sending it to a chosen "stash." (Keep in mind that, despite its name, Logstash itself does not preserve any data.) Kibana provides a user-friendly interface for querying and visualizing the data.

Figure 1: The ELK family and its relatives.

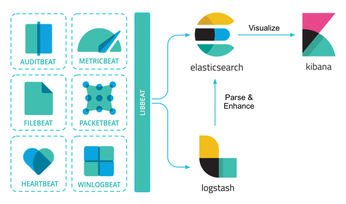
A bundle of tiny apps called beats specialize in collecting data and feeding it to Logstash or Elasticsearch. The beats include:

  • Filebeat – probably the most popular and commonly used member of the beats family. Filebeat is a log shipper that assigns subordinates, called harvesters, for each log to be read and fed into Logstash.
  • Heartbeat – an app that asks a simple question: Are you alive? Then it ships this information and response time to Elasticsearch. In other words it is a more advanced ping.
  • Winlogbeat – is used for monitoring a Windows-based infrastructure. Winlogbeat streams Windows event logs to Elasticsearch and Logstash.
  • Metricbeat – collects metrics from your systems and services. Metrics include CPU and memory disk storage, as well as data for Redis, Nginx, and much more. Metricbeat is a lightweight way to collect system and service data.

The collection also comes with several plugins that enhance functionality for the entire stack.

ELK Stack is popular in today's distributed environments because of its strong support for log management and analytics. Before you roll out a solution as complex and powerful as ELK Stack, though, you'll want to start by trying it out and experimenting with it in a test environment. It is easy to find overviews and short intros to ELK Stack, but it is a little more difficult to study the details. This workshop is a hands-on look at what it takes to get ELK Stack up and running.

ELK Installation

ELK Stack has lots of pieces, so it helps to use an automated deployment and configuration tool for the installation. I will use Ansible in this example. I hope to write this in a simple way that will be easy to follow even if you aren't familiar with Ansible, but see the Ansible project website [2] if you need additional information.

Listing 1 shows an Ansible playbook for installing the ELK Stack base applications. The first few lines define a few settings specific to Ansible itself, such as declaring that the execution will be local (and won't require an SSH network connection). become: true asks Ansible to run all commands with Sudo, which will allow you to run this playbook as a default Vagrant user instead of relogging to root. The tasks section lists the steps that will be executed in the playbook. There are multiple ways to install ELK Stack; Listing 1 uses the yum package manager and specifies a package repository. I specify the exact version numbers for the Elasticsearch, Logstash, and Kibana packages to make it easier to install the correct plugins later.

Listing 1

Ansible Playbook: elk-setup.yml

01 ---
02 - hosts: localhost
03   connection: local
04   gather_facts: false
05   become: true
06   tasks:
07     - name: Add Elasticsearch OpenSource repo
08       yum_repository:
09         name: Elasticsearch-OS
10         baseurl: https://artifacts.elastic.co/packages/oss-7.x/yum
11         description: ELK OpenSource repo
12         gpgcheck: false
13
14     - name: Install ELK stack
15       yum:
16         name: "{{ item }}"
17       loop:
18         - elasticsearch-oss-7.8.0-1
19         - logstash-oss-7.8.0-1
20         - kibana-oss-7.8.0-1

Once the software is installed, you need to run it as a service. You could use systemctl, but Listing 2 carries on using Ansible.

Listing 2

Are Elasticsearch and Kibana Enabled?

01     - name: Start ELK services
02       service:
03         name: "{{ item }}"
04         enabled: true
05         state: started
06       loop:
07         - elasticsearch
08         - kibana

The command in Listing 3 checks to ensure that Elasticsearch is running locally at the default port 9200.

Listing 3

Is Elasticsearch Running?

01 [vagrant@ELK ~]$ curl localhost:9200
02 {
03   "name" : "ELK",
04   "cluster_name" : "elasticsearch",
05   "version" : {
06     "number" : "7.8.0",
07     "minimum_wire_compatibility_version" : "6.8.0",
08     "minimum_index_compatibility_version" : "6.0.0-beta1"
09   },
10   "tagline" : "You Know, for Search"
11 }

Configuring ELK

ELK Stack is set up in a virtual machine and is only listening on localhost, so if you try to open Kibana or Elasticsearch in the host's browser, it won't work. You need to change the network.host setting in the YAML file to 0.0.0.0 to enable network operations.

The Elasticsearch YAML file is usually /etc/elasticsearch/elasticsearch.yml and Kibana and Logstash follow the same pattern. (The YAML config files installed with the RPM packages are quite verbose, though many of the settings are commented out.)

The most important change is to set network.host to 0.0.0.0. Keep in mind that Elasticsearch considers this change as enabling a production environment, therefore ELK Stack will expect a production environment to be running in a cluster. And since I am working in a single-node cluster, I need to set the value discovery.seed_hosts: [] – an empty list, in order to disable cluster discovery features.

The same applies to the Kibana dashboard. You need to modify the value server.hosts to 0.0.0.0 and restart the service.

You can use Ansible to help you get the default config YAML files for Kibana and ES (Listing 4). Store them in the files subdirectory of the playbook directory. Then you can make the required updates and use Ansible to replace the files. You'll need to restart the service if you make changes to the configuration.

Listing 4

elk-setup.yml: Getting the Files

01     - name: Copy file with Elasticsearch config
02       copy:
03         src: files/elasticsearch.yml
04         dest: /etc/elasticsearch/elasticsearch.yml
05         owner: root
06         group: elasticsearch
07         mode: '0660'
08       notify: restart_elasticsearch
09
10     - name: Copy file with Kibana config
11       copy:
12         src: files/kibana.yml
13         dest: /etc/kibana/kibana.yml
14         owner: root
15         group: kibana
16         mode: '0660'
17       notify: restart_kibana
18
19   handlers:
20     - name: Restart Elasticsearch
21       service:
22         name: elasticsearch
23         state: restarted
24       listen: restart_elasticsearch
25
26     - name: Restart Kibana
27       service:
28         name: kibana
29         state: restarted
30       listen: restart_kibana

Listing 4 uses a notify directive to create notifications that will be monitored in the handlers section.

Collecting Data with Beats

Now that the ELK services are up and running, I'll show you how to use Metricbeat and Filebeat to collect data. As I mentioned previously, Metricbeat is designed to collect system and service metrics, and Filebeat collects data from logfiles.

The first step is to set up a dummy Nginx application that will serve as a monitored node (Listing 5).

Listing 5

Provision a Monitored Node

01 ---
02 # ...
03   tasks:
04   - name: Add epel-release repo
05     yum:
06       name: epel-release
07       state: present
08
09   - name: Install Nginx
10     yum:
11       name: nginx
12       state: present
13
14   - name: Insert Index Page
15     template:
16       src: index.html.j2
17       dest: /usr/share/nginx/html/index.html
18
19   - name: Start Nginx
20     service:
21       name: nginx
22       state: started

Most of the tasks in Listing 5 are self-explanatory except the third one, which takes a local file with jinja2 formatting and renders it into the chosen destination format. In this case, I insert a hostname to display it on an HTTP page (Listing 6).

Listing 6

index.html.j2: Minimal HTML File

01 <!doctype html>
02 <html>
03   <head>
04     <title>{{ hostname }} dummy page</title>
05   </head>
06   <body>
07   <h1>Host {{ hostname }}</h1>
08     <p>Welcomes You</p>
09   </body>
10 </html>

I'll use Metricbeat to collect statistics on the monitored node. The YAML file in Listing 7 shows a Metricbeat configuration file that will collect data on the CPU, RAM, disk usage, and a few other metrics.

Listing 7

metricbeat.yml

01 metricbeat.modules:
02 - module: system
03   period: 30s
04   metricsets:
05     - cpu            # CPU usage
06     - load           # CPU load averages
07     - service        # systemd service information
08   # Configure the metric types that are included by these metricsets.
09   cpu.metrics:  ["percentages", "normalized_percentages"]
10 - module: nginx
11   metricsets: ["stubstatus"]
12   period: 10s
13   hosts:
14   - "http://127.0.0.1"
15   server_status_path: "/nginx_status"
16 tags:
17 - slave
18 - test
19 #fields:
20 #  hostname: ${HOSTNAME:?Missing hostname env variable}
21 processors:
22   - fingerprint:
23       fields: ['.*']
24       ignore_missing: true
25 output.elasticsearch.hosts: ["172.22.222.222:9200"]
26 setup.kibana.host: "http://172.22.222.222:5601"
27 setup.dashboards.enabled: true

Metricbeat supports several different modules dedicated to monitoring different services. One of the most commonly used modules is the system module, which collects metrics related to the system. Some of the metrics have individual configuration settings, such as cpu and core, which you can see in lines 21-22.

The Metricbeat config file contains three sections: tags, fields, and processors. The tags section adds new list-type fields. In the fields section, you can append key-value entries to send to JSON.

Beats environment variables behave like environment variables in Bash and take the form ${VAR_NAME}. You can provide a default value to use if no other value is found with ${VAR_NAME:some_default_value}. To enforce the presence of the variable, use ${VAR_NAME:?error message}, in which case Metricbeat will fail to start and log an error message if the environment variable is not found. The most advanced modifiers are in the processors section. Processor settings can dynamically adjust to events, in this case: compute fingerprints from chosen fields. There are many variations of processors that perform tasks such as conditionally adding or removing fields or even executing simple JavaScript snippets that modify our event data.

Another popular module for metrics collection is Nginx, which collects numbers from the Nginx status page. However before you can use the Nginx module, you need to enable the status page for scraping.

Listing 8 shows the section of the nginx.conf configuration file that will enable metrics and configure security so that attempts to reach the status page must come from the host itself. Because the scraper will collect metrics every few seconds, there is no point in logging each entry in access_log, therefore the access_log setting is turned off.

Listing 8

nginx.conf Excerpt

21          location /nginx_status {
22            stub_status on;
23            access_log   off;
24            allow 127.0.0.1;
25            allow ::1;
26            deny all;
27          }

Listing 9 shows the Ansible playbook section that deploys Nginx and Metricbeat.

Listing 9

Deploying Nginx and Metricbeat

01 (...)
02   - name: Copy Nginx config
03     copy:
04       src: nginx.conf
05       dest: /etc/nginx/nginx.conf
06       owner: root
07       group: root
08       mode: '0644'
09     notify: restart_nginx
10
11   - name: Install Beats
12     yum:
13       name: "{{ item }}"
14     loop:
15       - metricbeat-7.8.0-1
16       - filebeat-7.8.0-1
17
18   - name: Start Beats services
19     service:
20       name: "{{ item }}"
21       enabled: true
22       state: started
23     loop:
24       - metricbeat
25       - filebeat
26
27   - name: Copy file with Metricbeat config
28     copy:
29       src: metricbeat.yml
30       dest: /etc/metricbeat/metricbeat.yml
31       owner: root
32       group: root
33       mode: '0644'
34     notify: restart_metricbeat

Buy this article as PDF

Express-Checkout as PDF
Price $2.95
(incl. VAT)

Buy Linux Magazine

SINGLE ISSUES
 
SUBSCRIPTIONS
 
TABLET & SMARTPHONE APPS
Get it on Google Play

US / Canada

Get it on Google Play

UK / Australia

Related content

  • ELK Stack

    A powerful search engine, a tool for processing and normalizing protocols, and another for visualizing the results – Elasticsearch, Logstash, and Kibana form the ELK stack, which helps admins manage logfiles on high-volume systems.

  • Logstash

    When something goes wrong on a system, the logfile is the first place to look for troubleshooting clues. Logstash, a log server with built-in analysis tools, consolidates logs from many servers and even makes the data searchable.

  • FAQ

    Big data is like The Matrix – Better without the sequel

  • Perl – Elasticsearch

    Websites often offer readers links to articles about similar topics. Using Elasticsearch, the free search engine, is one way to find related documents instantly and automatically.

  • Tutorials – Collectd

    The collectd tool harvests your system stats and stores them for plotting into colorful graphs.

comments powered by Disqus
Subscribe to our Linux Newsletters
Find Linux and Open Source Jobs
Subscribe to our ADMIN Newsletters

Support Our Work

Linux Magazine content is made possible with support from readers like you. Please consider contributing when you’ve found an article to be beneficial.

Learn More

News