Reading Weather Data with Software-Defined Radio
Waverider – Software Defined Radio
ByArmed with a US$ 20 hunk of hardware and a free software-defined radio tool, we start the hunt for radio-transmitted data from a weather station.
Weather stations with transmitters (Figure 1) are used in many households today, including my own. The small transmitter, in this case, is on the window sill, measuring weather data such as temperature, air pressure, and humidity and transmitting the results digitally to a base station, which then displays them. However, a base station is not even necessary for receiving the data. With a little passion for tinkering, and the help of software-defined radio, I can receive, read, and even produce this wireless data with my own computer.

Software-defined radio (SDR) picks up electromagnetic waves almost directly at the antenna and uses software to process them. In the simplest case, an SDR-receiver consists of an antenna and an analog-to-digital converter plus software. Depending on the device, it can thus scan a very large frequency range. Applications for implementing SDR include GNU Radio, GNU Radio Companion, or Gqrx.
The software does the majority of the work, so your soldering iron can stay safely in the cabinet. You only need to find the right hardware, which costs only a few dollars, as well as an editor to process the digitized radio data on your computer.
The Hardware
The first step is to find the right reception hardware. Although specially developed hardware is quite expensive, DVB-T sticks at around US$ 20 offer a very convenient entry point into SDR, as long as they use a Realtek chipset (RTL2832U). The whole thing operates under the RTL SDR umbrella and relies on Librtlsdr library.
A look at my weather station shows that it receives data on 868MHz. Online sources list various chipsets and the frequency ranges they cover. On the recommendation of a colleague, I bought a Terratec Cinergy T Stick RC with Elonics chipset that covers the largest frequency range of the listed DVB-T receivers – and that includes the weather sensor’s frequency. The hardware cost me US$ 25; a rod antenna is included.
Software
The basis for the installation was a netbook with Mint 15; the GNU Radio Framework helped to analyze the received radio signals. This kind of kit even includes a graphical editor and supports raw data signal processing (optionally also in realtime) to create a target format with the help of various filters. The software automatically generates Python code that processes the data.
To use the DVB-T stick as a receiver, I first need the RTL SDR package. Typing:
git clone git://git.osmocom.org/rtl-sdr.git
installs RTL SDR on my computer. Gentoo and Arch Linux include prebuilt packages; on Ubuntu, you can install the software from a PPA (see the “GNU Radio from a PPA” section).
Building the software from the source works with cmake, but there’s a catch: RTL-SDR uses the libusb library to communicate with the stick. However, when certain drivers are loaded, the software fails to correctly talk to the stick. My Mint system loaded the modules from Listing 1. Listing 2 shows a guide from the website [1] for building the software from the source code.
| Listing 1: lsmod | head 7 |
e4000 12862 1 rtl2832 13312 1 dvb_usb_rtl28xxu 18737 0 rtl2830 13511 1 dvb_usb_rtl28xxu dvb_usb_v2 22916 1 dvb_usb_rtl28xxu dvb_core 90402 3 rtl2830,rtl2832,dvb_usb_v2 rc_core 21266 3 dvb_usb_rtl28xxu,dvb_usb_v2 |
| Listing 2: Compiling rtl-sdr |
cd rtl-sdr/ mkdir build cd build cmake ../ make sudo make install sudo ldconfig |
Gnu Radio from a PPA
Before plugging in the hardware, Ubuntu users need to create a udev file. To this end, run lsusb to determine the vendor and product ID of your DVB-T stick and issue the following command as root:
echo 'SUBSYSTEM=="usb", ATTRS{idVendor}=="Vendor_ID", \
      ATTRS{idProduct}=="Product_ID", GROUP="adm", MODE="0666", \
      SYMLINK+="rtl_sdr"' > /etc/udev/rules.d/20.rtlsdr.rules
This command writes a new rule for udev that references the DVB-T stick. You also need to restart udev as root before connecting the stick:
service udev restart
Ubuntu users install the Debian packages of GNU Radio and Gqrx from a PPA:
sudo add-apt-repository ppa:gqrx/snapshots
sudo apt-get update
sudo apt-get install gqrx gnuradio
Testing, Testing, 123 …
To prevent the modules from loading, the udev rules need to be modified. To do this, I had to expand the cmake call adding the -DINSTALL_UDEV_RULES = ON parameter and then still issue the following command:
sudo make install-udev-rules
after doing so. You can now read the hardware functions as follows
rtl_test -t
to find out about, for example, which frequency range the DVB-T stick covers. Another practical test would be to receive a local radio station:
rtl_fm -f 98.5M -W -s 200000 -r 48000 - | aplay -r 48k -f S16_LE
The demodulator rtl_fm takes 200,000 samples per second on a frequency of 98.5MHz (the frequency of a radio transmitter). The aplay command plays the data stream on stdout at a rate of 48kHz. Because the raw audio file does not contain header information, aplay reads the data at this rate and encodes it with 16-bit in little-endian format.
Analysis
To find interesting signals in the ether, a spot of listening is now in order. The command I used previously for listening to the radio delivers noise on other frequencies if nothing is transmitting. Digital signals sound different from noise and thus provide input for further analysis. (Keep in mind that some jurisdictions limit the frequency ranges authorized for casual listening and might prohibit intercepting police and emergency broadcasts.)
To scan larger frequency ranges, you will need a program like Gqrx, which offers a practical front end, visually processing the data to create line and waterfall charts (Figure 2).

And Now for the Weather
Because the right frequency is printed on my weather station, luckily, there was no need to search. When I set the frequency to 868MHz, I could hear pops every few seconds; I recorded and then analyzed these transmissions with the Audacity audio editor. Importing the data resulted in the test image from Figure 3.
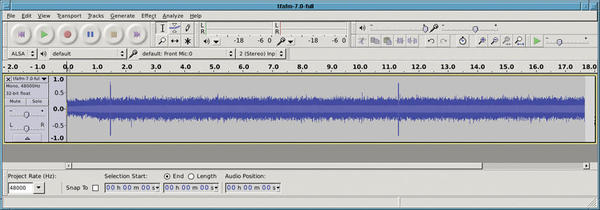
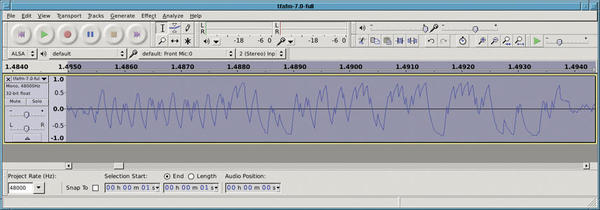
In fact, the magnified view revealed a pattern. I now had to decode the signal to read the temperature and humidity. An Internet search showed that someone had already done this work.
Christophe Jacquet’s Pydemod package assumes a 16-bit preamble, consisting of 1010101010101010. Following this, a sensor (see the Pydemod website) sends 17200 baud signal using on-off keying. For a rising curve, as shown of Figure 5, 1 is transmitted, while a 0 is sent for a drop. To discover whether the values are rising, evaluate the ratio of the numerical values of the samples compared with the baud rate.
My initial tests, which evaluated data from rtl_fm using decode_tfa.py, remained inconclusive. Unfortunately, Christophe’s records did not indicate how he called rtl_fm to obtain the raw data for the analysis. Also, the screenshot of the received data in his blog looked very different from mine.
Luckily, Christophe helped me out and expanded his script so that it also works with the data from my weather sensor. We discovered the following problems:
- My samples were created with the wrong modulation method. The transmitter modulates the amplitude not the frequency. It is therefore necessary to run rtl_fm with the -M parameter.
- My transmitter sends the data at 9600 instead of 17200 baud.
- The data preamble was not 1010101010101010, but 101010101010101010101010, so it was actually 24 bits instead of 16.
I found another difference between my test system and Christophe’s data: His radio reception system, a FUNcube dongle, supplied the data in big-endian format; the DVB-T stick used in my test, however, used little-endian format. Christophe had to adjust the section code that transforms the raw samples to numbers for further processing.
The temperature coding remained the same in both scenarios. Three nibbles (4 bits) encode a temperature digit in BCD (Binary Coded Decimal), where the third digit shows tenths of a degree. My temperature sensor added 40 to the temperature reading, presumably to handle degrees below zero. The next 8 bits then encode the humidity.
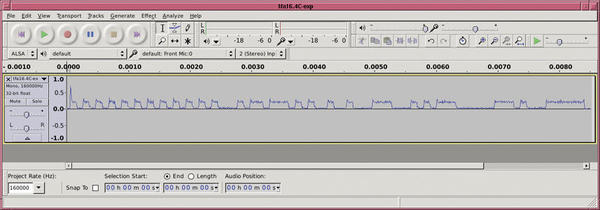
The first version of the script also assumed that the input was a WAV file that contained exactly the bits with the information and no noise. The script, which Christophe has now significantly revised and expanded, includes a few more new features, such as:
- It detects a data peak when the numerical value of the sample exceeds a limit. This currently limit is set to 4000, but you can change it – depending on the transmitter output.
- The data can also be present in raw mode, that is, without a WAV header, but at the moment, the rate must be 160,000 per second.
- The length of the preamble is managed by a separate parameter.
- You can adjust the baud rate for the data transfer.
The following call generates a stream of temperature measurements:
rtl_fm -M -f 868.4M -s 160k - | python decode_tfa.py --raw - --bitrate 9600 --synclen 24
Listing 3 shows the output from the command. From time to time, the measurement data is faulty. You can detect a problem because a checksum is included, and its expected value and determined value are output. If the expected and determined values deviate from each other, a measurement error has occurred. Extreme temperature jumps are actually impossible; however, two measurements can differ by more than 1 degree Celsius.
| Listing 3: Output from rtl_fm |
Found 1 device(s): 0: Realtek, RTL2838UHIDIR, SN: 00000001 Using device 0: Terratec Cinergy T Stick RC (Rev.3) Found Elonics E4000 tuner Bitrate: 9600, synclen: 24, framelen: 80 Using frame duration 1600.0 samples Squelch at 2200, should be slightly greater than usual max; use --squelch to change Oversampling input by: 7x. Oversampling output by: 1x. Buffer size: 7.31ms Tuned to 868679999 Hz. Sampling at 1120000 Hz. Output at 160000 Hz. Exact sample rate is: 1120000.035604 Hz Tuner gain set to automatic. Min: 0 - Mean: 273.97845 - Max: 1224 --------------------------------------- Frame: size 98 bits, contents \ 10101010101010101010101000111101110101000000000000000000000000000000000000000000000000000000000000, \ framelen=80 Frame hex contents: AA AA AA 3D D4 00 00 00 00 00 CRC: calculated=00, received=00 Temperature: -40.0 C -- Humidity: 0 % --------------------------------------- Min: 0 - Mean: 270.3753 - Max: 1260 --------------------------------------- Frame: size 96 bits, contents \ 101010101010101010101010001011011101010010010001110001000110001001001001011001010000000000000000, \ framelen=80 Frame hex contents: AA AA AA 2D D4 91 C4 62 49 65 CRC: calculated=65, received=65 Temperature: 6.2 C -- Humidity: 73 % --------------------------------------- |
In practical tests, we found that the antenna should not be too far from the receiver. Even at a distance of 5 meters, the peak value dropped significantly in my tests. If the value is too close to the noise, the script cannot detect the beginning of the data.
The Python script outputs the minimum, maximum, and average values at runtime. However, in a practice test, it happened again and again that the deflection returned by the stick was too weak. This problem might be due to automatic signal amplification. You can either fix the value using the -g value parameter or unplug the stick and plug it back into the computer.
Easy Weather
With very little financial outlay and, ultimately, very little software, you can solve the problem of reading data from a weather station and converting into a digitally processable format. The base station of my test device also receives data with weather and pollen forecasts via the legacy pager network. You can receive and decode this pager data using the multimode-ng tool. The pager data is sent in plain text, but the string encoding is still undocumented.
A big thank you goes to Christophe Jacquet for the modifications to his script that allowed for real-time streaming.
Author
Konstantin Agouros works for n.runs AG as a consultant for network security. His focus is on cellular networks. His book DNS/DHCP is published by Open Source Press.
Subscribe to our Linux Newsletters
Find Linux and Open Source Jobs
Subscribe to our ADMIN Newsletters
Support Our Work
Linux Magazine content is made possible with support from readers like you. Please consider contributing when you’ve found an article to be beneficial.

News
-
CIQ Releases Compatibility Catalog for Rocky Linux
The company behind Rocky Linux is making an open catalog available to developers, hobbyists, and other contributors, so they can verify and publish compatibility with the CIQ lineup.
-
KDE Gets Some Resuscitation
KDE is bringing back two themes that vanished a few years ago, putting a bit more air under its wings.
-
Ubuntu 26.04 Beta Arrives with Some Surprises
Ubuntu 26.04 is almost here, but the beta version has been released, and it might surprise some people.
-
Ubuntu MATE Dev Leaving After 12 years
Martin Wimpress, the maintainer of Ubuntu MATE, is now searching for his successor. Are you the next in line?
-
Kali Linux Waxes Nostalgic with BackTrack Mode
For those who've used Kali Linux since its inception, the changes with the new release are sure to put a smile on your face.
-
Gnome 50 Smooths Out NVIDIA GPU Issues
Gamers rejoice, your favorite pastime just got better with Gnome 50 and NVIDIA GPUs.
-
System76 Retools Thelio Desktop
The new Thelio Mira has landed with improved performance, repairability, and front-facing ports alongside a high-quality tempered glass facade.
-
Some Linux Distros Skirt Age Verification Laws
After California introduced an age verification law recently, open source operating system developers have had to get creative with how they deal with it.
-
UN Creates Open Source Portal
In a quest to strengthen open source collaboration, the United Nations Office of Information and Communications Technology has created a new portal.
-
Latest Linux Kernel RC Contains Changes Galore
Linux kernel 7.0-rc3 includes more changes than have been made in a single release in recent history.