Visualize your network with Skydive
A picture is worth a thousand words, and sometimes, a visual image of your network can save you hours of troubleshooting. Skydive [1] is an open source network analyzer designed to provide a graphical representation of the IT components and how they interact. I'm not talking about wiring but about the data flows between the nodes. Skydive stores this information in a central location. You can interact with Skydive using a web interface, the command line, or an API.
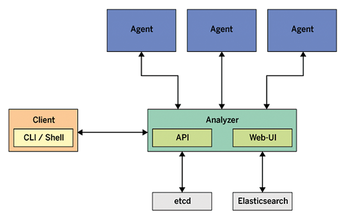
Skydive consists of a central analyzer and many agents (Figure 1). The agents run on Linux hosts and report network configuration and statistics to the analyzer. The analyzer listens to feedback from its agents and stores the input in a database. Gradually, the analyzer gets to know the entire topology and traffic flows between endpoints. The admin can access the new Skydive instance via the analyzer's web interface.
[...]
Buy this article as PDF
(incl. VAT)
Buy Linux Magazine
Subscribe to our Linux Newsletters
Find Linux and Open Source Jobs
Subscribe to our ADMIN Newsletters
Support Our Work
Linux Magazine content is made possible with support from readers like you. Please consider contributing when you’ve found an article to be beneficial.

News
-
Nitrux 6.0 Now Ready to Rock Your World
The latest iteration of the Debian-based distribution includes all kinds of newness.
-
Linux Foundation Reports that Open Source Delivers Better ROI
In a report that may surprise no one in the Linux community, the Linux Foundation found that businesses are finding a 5X return on investment with open source software.
-
Keep Android Open
Google has announced that, soon, anyone looking to develop Android apps will have to first register centrally with Google.
-
Kernel 7.0 Now in Testing
Linus Torvalds has announced the first Release Candidate (RC) for the 7.x kernel is available for those who want to test it.
-
Introducing matrixOS, an Immutable Gentoo-Based Linux Distro
It was only a matter of time before a developer decided one of the most challenging Linux distributions needed to be immutable.
-
Chaos Comes to KDE in KaOS
KaOS devs are making a major change to the distribution, and it all comes down to one system.
-
New Linux Botnet Discovered
The SSHStalker botnet uses IRC C2 to control systems via legacy Linux kernel exploits.
-
The Next Linux Kernel Turns 7.0
Linus Torvalds has announced that after Linux kernel 6.19, we'll finally reach the 7.0 iteration stage.
-
Linux From Scratch Drops SysVinit Support
LFS will no longer support SysVinit.
-
LibreOffice 26.2 Now Available
With new features, improvements, and bug fixes, LibreOffice 26.2 delivers a modern, polished office suite without compromise.