Perl scripts analyze Jawbone UP data
To counter the widespread tendency to excessive body fat, many smartphone owners now carry little gadgets around with them, reminding them of their lack of physical activity during the day. If you sit motionless for hours in front of the screen, the idea is that such a device could motivate you to walk around the block more often, or at least use the upstairs bathroom. This trend toward self-measurement – known as quantifying yourself – has grown very popular lately.
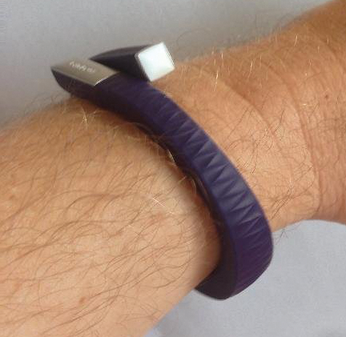
An electronic bracelet like the UP [1] by Jawbone measures the steps you take and shows the distance traveled and calories burned in the associated smartphone app (Figure 1). The accessory is available in three sizes and several colors and costs about US$ 130. From a functional point of view, the device seems to capture only instantaneous acceleration values and accumulates them over time. The geographical position of the wearer could be determined with a GPS chip, but this added function would probably drain the device's small battery in next to no time.
[...]
Buy this article as PDF
(incl. VAT)
Buy Linux Magazine
US / Canada
UK / Australia
Subscribe to our Linux Newsletters
Find Linux and Open Source Jobs
Subscribe to our ADMIN Newsletters
Support Our Work
Linux Magazine content is made possible with support from readers like you. Please consider contributing when you’ve found an article to be beneficial.

News
-
Plasma Ends LTS Releases
The KDE Plasma development team is doing away with the LTS releases for a good reason.
-
Arch Linux Available for Windows Subsystem for Linux
If you've ever wanted to use a rolling release distribution with WSL, now's your chance.
-
System76 Releases COSMIC Alpha 7
With scores of bug fixes and a really cool workspaces feature, COSMIC is looking to soon migrate from alpha to beta.
-
OpenMandriva Lx 6.0 Available for Installation
The latest release of OpenMandriva has arrived with a new kernel, an updated Plasma desktop, and a server edition.
-
TrueNAS 25.04 Arrives with Thousands of Changes
One of the most popular Linux-based NAS solutions has rolled out the latest edition, based on Ubuntu 25.04.
-
Fedora 42 Available with Two New Spins
The latest release from the Fedora Project includes the usual updates, a new kernel, an official KDE Plasma spin, and a new System76 spin.
-
So Long, ArcoLinux
The ArcoLinux distribution is the latest Linux distribution to shut down.
-
What Open Source Pros Look for in a Job Role
Learn what professionals in technical and non-technical roles say is most important when seeking a new position.
-
Asahi Linux Runs into Issues with M4 Support
Due to Apple Silicon changes, the Asahi Linux project is at odds with adding support for the M4 chips.
-
Plasma 6.3.4 Now Available
Although not a major release, Plasma 6.3.4 does fix some bugs and offer a subtle change for the Plasma sidebar.