Getting started with the ELK Stack monitoring solution
Elk Hunting

© Photo by David Santoyo on Unsplash
ELK Stack is a powerful monitoring system known for efficient log management and versatile visualization. This hands-on workshop will help you take your first steps with setting up your own ELK Stack monitoring solution.
Today's networks require a monitoring solution with industrial-strength log management and analytics. One option that has gained popularity in recent years is ELK stack [1]. The free and open source ELK Stack collection is maintained by a company called Elastic. (According to the website, the company has recently changed the name of the project to Elastic Stack, but the previous name is still in common usage.) ELK Stack is not a single tool but a collection of tools (Figure 1). The ELK acronym highlights the importance of the collection's three most important utilities. At the heart of the stack, Elasticsearch collects and maintains data, providing an engine, based on Apache Lucene, for searching through it. Logstash serves as the log processing pipeline, collecting data from a multitude of sources, transforming it, then sending it to a chosen "stash." (Keep in mind that, despite its name, Logstash itself does not preserve any data.) Kibana provides a user-friendly interface for querying and visualizing the data.
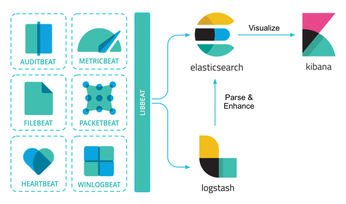
A bundle of tiny apps called beats specialize in collecting data and feeding it to Logstash or Elasticsearch. The beats include:
[...]
Buy this article as PDF
(incl. VAT)
Buy Linux Magazine
Subscribe to our Linux Newsletters
Find Linux and Open Source Jobs
Subscribe to our ADMIN Newsletters
Support Our Work
Linux Magazine content is made possible with support from readers like you. Please consider contributing when you’ve found an article to be beneficial.

News
-
Substantial Update to IPFire Now Available
The lastest version of IPFire features a fundamental change to how the system handles DNS.
-
Gnome Working on Test Center App to Make Testing Easier
It's now possible to test experimental features on the Gnome desktop without worrying that you'll break things.
-
New Vulnerability Discovered in Linux Kernel
Hiding out for nearly 15 years, the Ghostlock vulnerability allows a standard logged-in user to gain root privileges.
-
New Linux Flaw Lets Attackers Escape VMs
A 16-year-old vulnerability allows an attacker to escape a virtual machine, gain access to the host, and execute malicious code.
-
Hannah Montana Linux Is Back!
Developer Noah Cagle decided the world needed the once obscure but beloved Linux distribution and gave it a decidedly pink refresh.
-
System76 Refreshes the Lemur Laptop
If you're looking for a laptop with tons of power and battery, look no further than the latest iteration of the System76 Lemur Pro.
-
More than 43 Million Lines of Code in Linux Kernel 7.2
Using the cloc utility, Michael Larabel of Phoronix discovered that Linux kernel 7.2 has over 43 million lines of code.
-
Kubuntu Focus Goes Ultra
The Kubuntu Focus team has upped the performance ante of its M2 and Zr laptops with the latest, greatest CPUs from Intel.
-
Linux Gamers May Soon See Less Mouse Lag in KDE Plasma
Gamers using KDE’s Plasma desktop have been suffering from a slight input delay in mouse movement that could lead to getting fragged.
-
Three Lines of Code Improve Linux Storage Performance
A developer changed three lines of code, giving Linux storage performance a 5% bump.