Illustrating mathematical concepts in video with Manim

Explainer

Article from Issue 248/2021
Author(s):

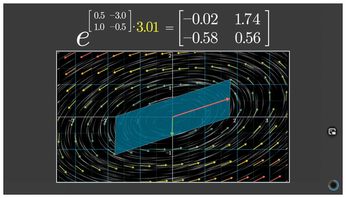
Manim lets you program video sequences with a few lines of Python code to present mathematical problems in an engaging and scientifically accurate way.

A precise description of a complex problem is sometimes difficult to achieve. Plain text will work eventually, but it often requires a great deal of imagination on the part of the reader. In a conventional classroom setting, an instructor might attempt to illustrate a topic by drawing on a chalkboard or whiteboard during a lecture, but it is fair to ask whether the power of the computer might offer a better option than a professor talking and writing at the same time. Presentation tools such as Impress or PowerPoint evolved as a way to illustrate key concepts in advance, but these tools typically have limited support for mathematical expressions, and they tend to present information in a static, slide show format. Movies and video sequences, on the other hand, can follow a spoken presentation organically in a way that often enhances learning and builds understanding.

However, shooting, trimming, and post-editing video footage can take time, even if you are experienced with video production. Manim [1] is a computer graphics tool that speeds up the task of building mathematical relationships into videos (Figure 1), letting you create a graphic video image with a simple Python script.

Figure 1: Graphic images can help the reader makes sense of mathematical expressions. © Grant Sanderson

Manim, which is based on Python, combines the Cairo graphics library, the FFmpeg recording program, the SoX sound tool, and the LaTeX word processing system. SoX and LaTeX let you create optional acoustic effects and output mathematical formulas. The finished video all lands in an MP4 file.

The name Manim is an abbreviation of the words "mathematical animations," which describes the basic idea behind the project. The software was created by US mathematician and developer Grant Sanderson, who uses it for his mathematical explainer videos on his science channel 3Blue1Brown [2]. The videos at the 3Blue1Brown site offer insights into how to use Manim for creating engaging and informative presentations on technical topics. Each video is a moving tapestry, with equations, graphics, geometric shapes, and occasional cartoon characters emerging and disappearing to illustrate concepts described in a spoken narrative (Figure 2).

Figure 2: Manim is capable of illustrating some extremely complicated concepts. © Grant Sanderson

A community variant of Manim is also available. The community version is based on Sanderson's code but maintained separately by the community [3]. Both variants of Manim are on GitHub [4].

Manim consists of two parts: the program code for creating the visualization effects for the videos on 3Blue1Brown and the general code. The code for the 3Blue1Brown videos has a proprietary license (rights are held by 3Blue1Brown). The general code is under an MIT free software license. I used the original variant on a Debian 10.6 system when writing this article.

Installation

Currently you won't find Manim packages for the popular Linux distributions, so you will need to go to a bit of manual work to compile and install it. As for dependencies, Manim requires Python version 3.7 or newer and the Python package manager pip with some development libraries, FFmpeg, SoX, Git, and LaTeX. LaTeX (which alone requires around 2.5GB of disk space) is optional.

If you need to install any of these dependencies, retrieve them with your favorite package manager (Listing 1, line 1).

Listing 1

Installation and Initial Startup

01 # apt-get install python3.7 python3-pip ffmpeg sox libcairo2-dev libjpeg-dev libgif-dev git
02 # apt-get install texlive-full
03 # apt-get install texlive-latex-base texlive-latex-extra texlive-fonts-extra
04 $ git clone https://github.com/3b1b/manim.git
05 $ cd manim/
06 $ python3 -m pip install -r requirements.txt
07 $ python3 manim.py example_scenes.py SquareToCircle -lp

For LaTeX, you need either the texlive-full package or the three other packages, texlive-latex-base, texlive-latex-extra, and texlive-fonts-extra. The full installation is handled by the call from line 2 of Listing 1; line 3 installs the three packages.

Line 4 gets the Manim library from the GitHub repository. The command creates the manim/ folder in the current directory, to which you then change (line 5). The command in line 6 adds other libraries that might still be missing. Depending on your hardware, this step could take some time, as it involves picking up the current source code for the libraries and compiling it for your system.

Use the command from line 7 in Listing 1 to create your first video. The code refers to the sample script, example_scenes.py. The first parameter specified in the call designates the Manim library as a local Python file. This is followed by the sample script with the animations and, as the third parameter, the name of the class in the sample script with the animations you want Manim to execute. At the same time, it serves as the name of the output file, which is automatically given an extension of .mp4.

Two switches follow at the end: -l ("lower") causes the video to be rendered in the slightly lower quality of 480p15 instead of 1440p60; -p ("preview") gives you immediate playback of the generated video file (Figure 3).

Figure 3: Rendering and playback of the sample scenes.

By default, Manim saves the generated files in ./media/videos/. You can adapt this path to suit your needs via the MEDIA_DIR environment variable.

Understanding Animations

The source code for the video from Figure 3 contains just a few lines. The code consists of the Python class SquareToCircle(), which derives from the internal Python class Scene() (Listing 2, line 1). SquareToCircle() contains only one method named construct() (line 2).

Listing 2

Sample Script

01 class SquareToCircle(Scene):
02   def construct(self):
03     circle = Circle()
04     square = Square()
05     square.flip(RIGHT)
06     square.rotate(-3 * TAU / 8)
07     circle.set_fill(PINK, opacity=0.5)
08
09     self.play(ShowCreation(square))
10     self.play(Transform(square, circle))
11     self.play(FadeOut(square))

Lines 3 and 4 define a Manim object named circle of the type Circle() and a square of type Square(). Lines 5 and 6 first initialize a clockwise rotation of the square via the rotate() method and then a rotation by the specified angle. The code from line 7 colors the circle pink, with an opacity of 50 percent.

Lines 9 to 11 use the play() method for three animations. Calling ShowCreation(square) creates the square, Transform(square, circle) renders the gradual transformation of the square into a pink circle, and FadeOut(square) slowly fades out the square.

Table 1 lists some of the geometric objects that Manim currently supports. This list is based on the analysis of the source code, since the documentation does not currently provide this information. Table 2 summarizes some of the animations that Manim supports. The existing documentation provides a reference.

Table 1

Geometric Objects

Object

Class

Arc

Arc(), ArcBetweenPoints()

Arrow

Arrow(), CurvedArrow(), CurvedDoubleArrow(), DoubleArrow()

Circle

Circle()

Dot

Dot(), SmallDot()

Ellipse

Ellipse()

Line

Line(), DashedLine(), TangentLine()

Polygon

Polygon(), RegularPolygon()

Triangle

Triangle()

Rectangle

Rectangle(), Square(), RoundedRectangle()

Table 2

Supported Animations

Animation

Method

Fade in and out

FadeIn(), FadeOut(), FadeInFrom(), FadeOutAndShift()

Grow

GrowFromPoint(), GrowFromCenter(), GrowFromEdge()

Transform and rotate

ClockwiseTransform(), CounterclockwiseTransform(), FadeToColor()

Rotate

Rotate()

Manim also offers the ability to change the camera position. You need this feature if you want to highlight parts of the overall image by zooming in and out, or visualize movement along an axis.

Manim in Practice

The gaps in the documentation make it a little difficult to get started with Manim. Blog posts [5] that explain the procedure for specific use cases [6] are helpful.

In Listing 3, lines 3 to 6 define a mathematical formula in LaTeX notation. Lines 7 and 8 define two rectangles and assign them to the second and fourth components of the formula. First, line 9 outputs the formula in full. Line 10 adds the first rectangle to it, after which the wait() method adds a pause. Line 12 replaces rectangle 1 with rectangle 2. Manim adds motion to it: The rectangle slides to the right to the end of the formula. Line 13 specifies a short pause before the video ends.

Listing 3

box.py

01 class MoveFrameBox(Scene):
02   def construct(self):
03     text=MathTex(
04       "\\frac{d}{dx}f(x)g(x)=","f(x)\\frac{d}{dx}g(x)","+",
05       "g(x)\\frac{d}{dx}f(x)"
06     )
07     framebox1 = SurroundingRectangle(text[1], buff = .1)
08     framebox2 = SurroundingRectangle(text[3], buff = .1)
09     self.play(Write(text))
10     self.play(ShowCreation(framebox1),)
11     self.wait()
12     self.play(ReplacementTransform(framebox1,framebox2),)
13     self.wait()

To see the effect, save the class in your Manim directory as a Python script box.py. To render the video (Figure 4), run the command from the first line of Listing 4.

Figure 4: Formula highlighting a component.

Listing 4

Rendering the Examples

$ python3 manim.py box.py MoveFrameBox -pl
$ python3 manim.py function.py SinusPlot -pl

The last example generates a graph of the sine function and plots it in a Cartesian coordinate system (Listing 5). A data structure named CONFIG specifies the appearance of the coordinate system. The Y axis runs from 0 to 100 (lines 3 and 4). The X axis has a vertical line, and the Y axis has a horizontal line every 10 units for ease of reading (lines 5 and 6). The Y axis shows the corresponding values.

Listing 5

function.py

01 class SinusPlot(GraphScene):
02   CONFIG = {
03     "y_min": 0,
04     "y_max": 100,
05     "y_axis_config": {"tick_frequency": 10},
06     "y_labeled_nums": np.arange(0, 100, 10)
07   }
08
09   def construct(self):
10     self.setup_axes()
11     dot = Dot().move_to(self.coords_to_point(PI / 2, 20))
12     func_graph = self.get_graph(lambda x: 20 * np.sin(x))
13     self.add(dot, func_graph)

The code starting in line 9 first outputs the two axes using the setup_axes() method (line 10). Line 11 creates a dot, which it places at position (Pi/2, 20) using the move_to() method. Line 12 uses get_graph() to define the instruction for the sine function; line 13 outputs the dot and the sine function.

Add this class to your Manim directory as a Python script, named function.py this time. Trigger rendering of the video with the command from the last line of Listing 4 (Figure 5).

Figure 5: Function plot with the sine function.

Buy this article as PDF

Express-Checkout as PDF
Price $2.95
(incl. VAT)

Buy Linux Magazine

SINGLE ISSUES
 
SUBSCRIPTIONS
 
TABLET & SMARTPHONE APPS
Get it on Google Play

US / Canada

Get it on Google Play

UK / Australia

Related content

  • Blender

    With a little help from Blender you can create your own 3D models – including animations. This article shows you how to assemble a partially automated virtual watch model with Blender and Python.

  • Moving Art

    Pencil2D, an easy-to-use painting and 2D animation program, lets you create small animations quickly. Despite the simple user interface, you might need a little help getting started.

  • Gaming for Godot

    Creating a game requires a wide set of skills to combine graphics, animations, sound, double-clicks, and meticulous coding. The free and open source Godot game engine provides you with all the tools you need to get started.

  • Trembling Text

    Writing your own extension for Inkscape opens up a whole world of possibilities. Apart from creating new objects, you can modify existing objects and even animate them.

  • Data Visualization in Python

    Python's powerful Matplotlib, Bokeh, PyQtGraph, and Pandas libraries lend programmers a helping hand when visualizing complex data and their relationships.

comments powered by Disqus
Subscribe to our Linux Newsletters
Find Linux and Open Source Jobs
Subscribe to our ADMIN Newsletters

Support Our Work

Linux Magazine content is made possible with support from readers like you. Please consider contributing when you’ve found an article to be beneficial.

Learn More

News