Program a game of bingo with ReportLab and Panda3D for Python

Bingo

© Photo by Josh Redd on Unsplash

© Photo by Josh Redd on Unsplash

Article from Issue 266/2023
Author(s):

A game of bingo illustrates how to use the ReportLab toolkit and Panda3D real-time 3D engine.

Python is great for a number of computing tasks: rapid prototyping, quick calculations, and data formatting, just to name a few. If the output of your perfect project needs to be more polished or ready to review immediately, you can use two libraries to generate unique outputs directly from Python. The ReportLab [1] toolkit generates PDF files, and Panda3D [2] creates a Python-controllable 3D world for dynamic computer graphics.

For the purposes of this project, I will use the game of bingo as an example. To begin, a set of bingo cards is generated with Python and ReportLab (Figure 1), then a bingo caller is put together with Python and Panda3D.
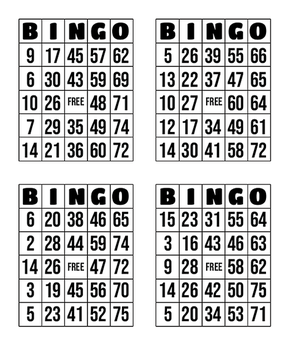
Figure 1: One page of the ReportLab output. Each page contains four bingo cards.

Bingo Card

In the US, the bingo card is traditionally a 5x5 grid with the center space "free" or automatically marked. The card has 75 possible numbers, 15 available in each column. Listing 1 prints four cards per page that can be cut apart.

Listing 1

bingo.py

01 from reportlab.pdfgen import canvas
02 from reportlab.lib.pagesizes import letter
03 from reportlab.lib.units import inch
04 import reportlab.rl_config
05 reportlab.rl_config.warnOnMissingFontGlyphs = 0
06 from reportlab.pdfbase import pdfmetrics
07 from reportlab.pdfbase.ttfonts import TTFont
08 pdfmetrics.registerFont(TTFont('Bebas', 'BebasNeue-Regular.ttf'))
09 pdfmetrics.registerFont ( TTFont ( 'Titan' , 'TitanOne-Regular.ttf' ) )
10 import random
11
12 class bingo:
13    def __init__ ( self ):
14       self.doc = canvas.Canvas ( "bingoCards.pdf" , pagesize = letter )
15       for i in range ( 25 ):
16          self.grid()
17          self.titles()
18          self.numbers()
19          self.freeSpace()
20          self.doc.showPage()
21       self.doc.save()
22
23    def grid ( self ):
24       self.doc.setStrokeColorRGB ( 0 , 0 , 0 )
25       for x in range ( 12 ):
26          for y in range ( 14 ):
27             if x != 5 and x != 11:
28                self.doc.line ( ( x * .68 + .5 ) * inch , ( y * .7 + 1  ) * inch , ( ( x + 1 ) * .68 + .5 ) * inch , ( y * .7 + 1 ) * inch )
29             if y != 7 and y != 0:
30                self.doc.line ( ( x * .68 + .5 ) * inch , ( y * .7 + 1 ) * inch , ( x * .68 + .5 ) * inch , ( ( y - 1 ) * .7 + 1 ) * inch )
31
32    def titles ( self ):
33       self.doc.setFont ( "Titan" , 50 )
34       self.doc.drawString ( .60 * inch , 9.5 * inch , "B  I  N G O" )
35       self.doc.drawString ( 4.68 * inch , 9.5 * inch , "B  I  N G O" )
36       self.doc.drawString ( .60 * inch , 4.6 * inch , "B  I  N G O" )
37       self.doc.drawString ( 4.68 * inch , 4.6 * inch , "B  I  N G O" )
38
39    def makeCard ( self ):
40       card = list()
41       for i in range ( 25 ):
42          while 1:
43             if i < 5: number = random.randint ( 1 , 15 )
44             elif i < 10: number = random.randint ( 16 , 30 )
45             elif i < 15: number = random.randint ( 31 , 45 )
46             elif i < 20: number = random.randint ( 46 , 60 )
47             elif i < 25: number = random.randint ( 61 , 75 )
48
49             if number not in card:
50                card.append ( number )
51                break
52       return card
53
54    def freeSpace ( self ):
55       self.doc.setFont ( "Bebas" , 24 )
56       self.doc.drawString ( 1.95 * inch , 7.55 * inch , "FREE" )
57       self.doc.drawString ( ( 1.95 + 4.1 ) * inch , 7.55 * inch , "FREE" )
58       self.doc.drawString ( ( 1.95 ) * inch , ( 7.55 - 4.9 ) * inch , "FREE" )
59       self.doc.drawString ( ( 1.95 + 4.1 ) * inch , ( 7.55 - 4.9 ) * inch , "FREE" )
60
61    def numbers ( self ):
62       card1 = self.makeCard()
63       card2 = self.makeCard()
64       card3 = self.makeCard()
65       card4 = self.makeCard()
66       self.doc.setFont ( "Bebas" , 45 )
67
68       y = 9.05
69       for i in range ( 25 ):
70          if i == 12:
71             y -= .7
72             continue
73
74          if i < 5: x = 0
75          elif i < 10: x = .68
76          elif i < 15: x = .68 * 2
77          elif i < 20: x = .68 * 3
78          elif i < 25: x = .68 * 4
79
80          if card1 [ i ] < 10: spacing = .15
81          else: spacing = 0
82          self.doc.drawString ( ( x + .57 + spacing ) * inch , ( y - .25 ) * inch , str ( card1 [ i ] ) )
83
84          if card2 [ i ] < 10: spacing = .15
85          else: spacing = 0
86          self.doc.drawString ( ( x + 4.65 + spacing ) * inch , ( y - .25 ) * inch , str ( card2 [ i ] ) )
87
88          if card3 [ i ] < 10: spacing = .15
89          else: spacing = 0
90          self.doc.drawString ( ( x + .57 + spacing ) * inch , ( y - 5.1 ) * inch , str ( card3 [ i ] ) )
91
92          if card4 [ i ] < 10: spacing = .15
93          else: spacing = 0
94          self.doc.drawString ( ( x + 4.65 + spacing ) * inch , ( y - 5.1 ) * inch , str ( card4 [ i ] ) )
95
96          y -= .7
97          if i == 4 or i == 9 or i == 14 or i == 19: y = 9.05
98 bingo()

The task of creating a bingo card has been divided into several steps – drawing the grid, adding the titles (top row of the card), filling each card with random numbers, adding the label for the free space – each completed by a Python function.

Setting Up

As with any project, you have to set up your workspace before you can do much else. In Python, that is usually done by adding import lines to bring in the libraries you want to use. ReportLab is a very large library, so its main functions have been divided into smaller modules. This way, you can import just what you need. The syntax is

from [library] import [module]

(lines 1-4, 6, 7). Line 5 disables some warnings when loading fonts, and lines 6 and 7 import the font libraries, whereas lines 8 and 9 actually import the fonts with pdfmetrics.registerFont bypassing a TTFont object. The first argument is an internal name that is used to refer to the font later. The second argument is the TTF filename.

To create a PDF, you have to start with a canvas (line 14) with a filename to write to and a pagesize. Just as in art, this is where everything is drawn. Once that is set up, you can start adding elements to the document. Line 15 starts a loop that iterates through each of 25 pages of the PDF so that, when it's done, you will have 100 bingo cards (four per page). Each page has the four grids, header rows for each card, and random numbers in all spaces except the labeled free space in the center (lines 16-19). I explore each of these functions more later. Finally, call self.doc.showPage (line 20) to add the page to the PDF and reset for the next page. Line 21 calls self.doc.save, which writes everything to disk.

The Grid

With the bingo grid being five rows tall and five columns wide, it also needs a header row, for a total of six rows. By creating a 2x2 "grid of grids" for four cards per page, those numbers are doubled. Adding an empty row and column between each card gives a total of 11 columns and 13 rows.

To start drawing, set the line color with self.doc.setStrokeColorRGB, which will stay the same until changed again. Then lines 25 and 26 set up two loops: one for x and one for y. Note that the loop ranges are 12 and 14 instead of 11 and 13 because in Python range stops one below the provided number. Lines 27 and 29 check the x and y values, respectively, and skip the center and end rows and columns. This way you have four cards rather than one big grid. Lines 28 and 30 draw a line from calculated values with self.doc.line, which expects the parameters starting x, starting y, ending x, and ending y, in that order. You will also notice * inch in every coordinate. See the sidebar "Units and Dimensions" for more about this.

Units and Dimensions

ReportLab is inherently unitless. The internal numbers used to generate PDFs only correspond to themselves. Those numbers translate into recognizable units with the reportlab.lib.units library, which defines several constants (e.g., inch and millimeter) that make any number passed in to a ReportLab function scale to the proper real-world size. Any time you pass a numerical dimension to ReportLab, it is multiplied by the appropriate constant – for example, 8.5 * inch.

Similarly, the reportlab.lib.pagesizes library has common paper sizes. Whereas letter is common in the US at 8.5 inches wide and 11 inches tall, in other parts of the world, A4 is the standard at 210mm wide and 297mm tall. Similarly, the terms "portrait" and "landscape" in the US refer to the orientation of the paper. Portrait lays out the longer dimension vertically, whereas landscape lays out the longer dimension horizontally.

As you can see, ReportLab gives you the tools to create nice PDFs with just about any content you might use. You can put this to use in data processing, batch scripts, or just about anything else to create an easy-to-read report that is generated as your files or data are being processed.

Buy this article as PDF

Express-Checkout as PDF
Price $2.95
(incl. VAT)

Buy Linux Magazine

SINGLE ISSUES
 
SUBSCRIPTIONS
 
TABLET & SMARTPHONE APPS
Get it on Google Play

US / Canada

Get it on Google Play

UK / Australia

Related content

  • DIY Scoreboard

    We look at a broadcast video system network that uses Python code to control a video router and check out another program that creates a scoreboard.

  • Panda3D

    Several free game engines are available for Linux users, but programming with them is often less than intuitive. Panda3D is an easy-to-use engine that is accessible enough for newcomers but still powerful enough for the pros at Disney Studios.

  • Top Coder

    Springtime is application time! Mike Schilli, who has experience with job application procedures at companies in Silicon Valley, digs up a question asked at the Google Engineering interview and explains a possible solution in Go.

  • Nerf Target Game

    A cool Nerf gun game for a neighborhood party provides a lesson in Python coding with multiple processors.

  • Tutorials – WM Tiling

    Regular window managers are so 2016 – install a tiling WM and work faster, smarter, and cooler.

comments powered by Disqus
Subscribe to our Linux Newsletters
Find Linux and Open Source Jobs
Subscribe to our ADMIN Newsletters

Support Our Work

Linux Magazine content is made possible with support from readers like you. Please consider contributing when you’ve found an article to be beneficial.

Learn More

News