


Creating a Status Dashboard for Your Home Server

Monitoring Maestro

© Lead Image © anatolik1986, 123RF.com
If you run a VPS or a home server, you might like to know the status of your services. Gatus provides you with a status dashboard and sends you alerts when something's amiss.
Many popular cloud services offer a public status page where customers can check whether a service is currently interrupted as well as the recent uptime. If you set up and maintain your own services – on a home server on your local network or a virtual private server (VPS) on the Internet – it would be nice to have a similar status page.
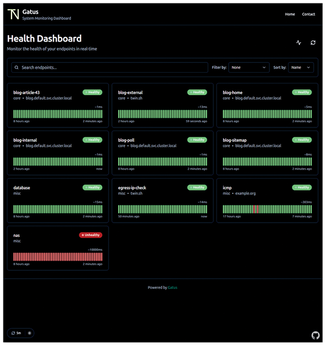
Gatus [1] lets you set up your own status dashboard, or, as the project terms it, a health dashboard (see Figure 1). Licensed under Apache 2.0, you can find Gatus' source code on GitHub [2]. With Gatus, you can monitor your services using HTTP, ICMP, TCP, DNS queries, and more. The results of these queries can be evaluated simply, using a status code or response time, or more complexly using a combination of conditions. For each of these health checks, Gatus can send an alert upon failure, using email or push notification software, such as ntfy.
Installing Gatus
If you don't want to install and maintain a monitoring solution yourself, Gatus offers a managed service, with subscription plans starting from $10 per month. However, deploying Gatus yourself isn't very complicated. In this article, I'll show you how to deploy Gatus using Docker Compose on a Debian 13 ("trixie") server.
First, you need to create configuration and data directories for the Gatus container:
mkdir -p ~/containers/gatus/{config,data}Then create an initial configuration file, config.yaml, in the config directory, containing the YAML code from Listing 1. This code specifies the location of an SQLite database file to store the results of health checks and uptime statistics, as well as one endpoint to monitor using ICMP ping messages.
Listing 1
config.yaml
01 storage:
02   type: sqlite
03   path: /data/data.db
04
05 endpoints:
06   - name: icmp-ping
07     url: "icmp://example.org"
08     interval: 1m
09     conditions:
10       - "[CONNECTED] == true"
Next, create a docker-compose.yml file with the container definition, as shown in Listing 2. For each volume, ensure the part before the colon refers to the directory you created for the configuration or data, and the part after the colon refers to the directory in the container that this is mapped to.
Listing 2
docker-compose.yml
01 services:
02   gatus:
03     image: twinproduction/gatus:latest
04     volumes:
05       - ./containers/gatus/config:/config
06       - ./containers/gatus/data:/data
07     ports:
08       - "8080:8080"
To complete the setup, run
docker-compose up -d
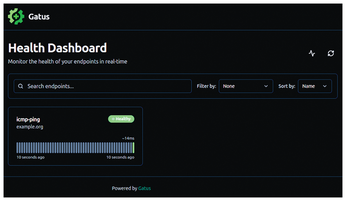
to start the container. If everything is set up correctly, you can now visit http://IP:8080 in your web browser (where IP is the container host's IP address) to view your own health dashboard, as shown in Figure 2.
Exploring Your Health Dashboard
The health dashboard shows the endpoint defined in the configuration file. Every minute, which is the interval you set in line 8 of Listing 1, Gatus sends an ICMP ping packet to the server example.org and adds a green bar if it receives a response from the server. It also marks the server as Healthy, and the average response time is shown at the top right of the stack of green bars. By clicking on the pulse icon at the top right of the dashboard, the minimum and maximum response times are revealed instead.
Each bar indicates the status of the service at a particular time: green when all is well, and red when the service is unavailable. The time range these bars cover is shown at the bottom (e.g., "10 minutes ago" in Figure 2). When you hover over one of the bars, you can see the exact timestamp when that check happened, the response time, and the conditions with their status. The simple case in Figure 2 has just one condition ("[CONNECTED] == true"), but if there were multiple conditions, you would see exactly which condition caused the status check to fail.
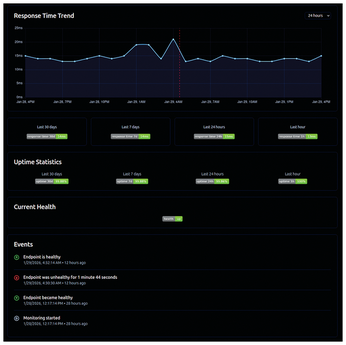
Clicking on the endpoint name (shown in bold) opens the endpoint's details page. This page provides a lot more information, including a graph with the response time trend, response time and uptime statistics, and events that changed the endpoint's health status (Figure 3).
Basic Configuration Settings
Before adding more endpoints, it's best to focus on some basis configuration settings to prevent problems later. Firstly, Gatus may report an endpoint on the Internet as unhealthy if Gatus itself loses Internet connectivity. In this situation, there's nothing wrong with the endpoint, but it would currently be marked as unhealthy. If you have set up Gatus to check multiple servers on the Internet, they would all be marked as unhealthy as soon as Gatus loses Internet connectivity. If you have alerts configured, you would receive notifications for all these endpoints simply because Gatus has an Internet connectivity issue.
To prevent this, you can configure Gatus to periodically check for Internet connectivity. You do this by specifying a host and a port that Gatus periodically connects to and an interval for this check. As long as this connectivity checker can't connect to the configured target, Gatus skips all endpoint checks. To do this, add the following lines to the config.yaml file:
connectivity:
  checker:
    target: 1.1.1.1:53
    interval: 15s
Naturally, this interval should be shorter than the shortest interval used for your endpoint checks.
Another issue to consider is if your servers automatically reboot for package upgrades, which is the case for immutable Linux distributions such as openSUSE MicroOS [3] or Fedora CoreOS [4]. When these upgrades happen on your system, your services will be unavailable for several minutes. Because Gatus can't reach the endpoints during this upgrade period, it will mark them as unhealthy and may send you alerts if configured. To avoid this, you can specify a maintenance window during which Gatus skips all endpoint checks. An example of such a maintenance window in config.yaml is
maintenance:
  start: "04:30"
  duration: 30m
  timezone: "Europe/Brussels"
Of course, not all endpoints will be in maintenance at the same time. Therefore, you can also specify maintenance windows on a per-endpoint basis, as shown in Listing 3.
Listing 3
An endpoint with a Maintenance Window
01 endpoints:
02   - name: icmp-ping
03     url: "icmp://example.org"
04     interval: 1m
05     conditions:
06       - "[CONNECTED] == true"
07     maintenance-windows:
08       - start: "04:30"
09         duration: 30m
10         timezone: "Europe/Brussels"
After making these changes to the configuration file and saving it, Gatus automatically reloads the dashboard. If the new configuration is invalid, Gatus will exit, and it will no longer check any endpoints, so make sure to check the container's logs with
docker-compose logs -f
after any configuration change.
Buy this article as PDF
(incl. VAT)
Buy Linux Magazine
Subscribe to our Linux Newsletters
Find Linux and Open Source Jobs
Subscribe to our ADMIN Newsletters
Support Our Work
Linux Magazine content is made possible with support from readers like you. Please consider contributing when you’ve found an article to be beneficial.

News
-
AI Fixes Linux Bottlenecks Using “Hideous” Code
A Linux developer used AI to fix bottlenecks that caused problems when building the kernel. The resulting AI-generated code needed a lot of work.
-
Advanced Video Coding Still Under Patent
Brazilian patent BRPI0109962B1 has expired, which means that DivX and Xvid are no longer problematic for Linux, but it doesn’t mean that video is all of a sudden fully unleashed.
-
2,000 Vulnerabilities per Linux Release
Thanks to AI bug hunters, the Linux kernel is seeing record numbers of vulnerabilities, and it's overwhelming developers.
-
Linux Exempt from California’s Age Verification Law
So long as Linux is distributed under the GPL, MIT, BSD, and Apache licenses, the OS is exempt from being required to verify the age of its users in California.
-
Roll Out the Cake: Linux Turns 35
35 years ago, a Finnish student began a humble project that would forever change the course of technology.
-
China Switching from Windows to Linux
China has ordered several government agencies to drop a Chinese-developed version of Windows 10 in favor of either KylinOS or UOS.
-
Pine64 Halts Production of Linux Devices
With continued DRAM and eMMC shortages, Pine64 has decided to discontinue production of Linux devices.
-
The Bullet-Proof KDE Software Initiative Is Coming
KDE, Techpaladin, and Kubuntu Focus have announced a new initiative that will provide at least three years of support for KDE Plasma 6.6 LTS and related software.
-
Linux Mint Shares a Possible Kernel Cleanup Solution
For those on Linux Mint who like to keep multiple kernels around but don't want them to take up too much space, you might be getting a new automated tool.
-
CachyOS Gets an Update
CachyOS August 2026 release is now available with the latest version of KDE, some new features, and plenty of improvements.