


Creating a Status Dashboard for Your Home Server
Checking Your Website
With the basics operational, you can now add various endpoints to monitor. Gatus requires the name and URL for each endpoint, but many other attributes are optional or have default values. For instance, the default interval for an endpoint check is one minute, so this line could be omitted in Listing 1 (line 8) and Listing 3 (line 4). Beyond the ICMP type of check I initially added, there are various other types of endpoint checks. I'll review some common ones.
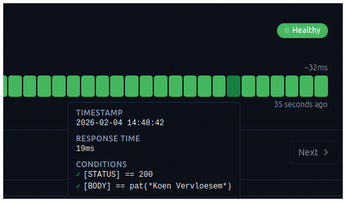
The most common type of endpoint check will likely be for a web page. You might want Gatus to visit a web page and mark it as healthy if the web server returns HTTP 200 OK as the response code. However, this only verifies that the web server returns something without errors. To ensure it returns the correct page, you can add another check that finds a text pattern in the response body. For instance, I configured Gatus to verify that my name appears in my website's response body as shown in Listing 4 (and the result depicted in Figure 4). If the web server returns an empty page due to some misconfiguration, Gatus will mark this endpoint as unhealthy.
Listing 4
Adding a Text Pattern Check
01 endpoints:
02   - name: Website
03     url: "https://koen.vervloesem.eu"
04     conditions:
05       - "[STATUS] == 200"
06       - "[BODY] == pat(*Koen Vervloesem*)"
Another useful check is whether your web server's domain still resolves to the correct IP address. Gatus can check this with a dns endpoint: You specify an endpoint with the URL of the DNS server to use, the domain you want to verify as the query name, and "A" as the query type ("A" signifies an IPv4 address query). In the conditions, you check for the correct IP address in the body and the response code NOERROR, as specified in Listing 5. Perform a similar check for the server's IPv6 address using the "AAAA" query type. Using these checks, Gatus immediately marks the endpoint as unhealthy if a DNS issue arises.
Listing 5
Verifying IPv4 Address
01   - name: Web server DNS IPv4
02     url: "1.1.1.1"
03     dns:
04       query-name: "koen.vervloesem.eu"
05       query-type: "A"
06     conditions:
07       - "[BODY] == 37.252.126.12"
08       - "[DNS_RCODE] == NOERROR"
Additionally, you can verify if a server accepts an SSH connection, as shown in Listing 6. By not providing a username, password, or private key, this simply confirms whether a connection is possible. To verify successful login, specify the username along with a password or private key.
Listing 6
Verifying SSH Connection
01   - name: Web server SSH
02     url: "ssh://koen.vervloesem.eu"
03     ssh:
04       username: ""
05       password: ""
06       private-key: ""
07     conditions:
08       - "[CONNECTED] == true"
09       - "[STATUS] == 0"
You can also monitor a domain's expiration, as well as a TLS certificate. Because domain expiration checks use an external service that throttles your IP address if you send too many requests, Gatus prevents you from using an interval of less than five minutes. An interval of one hour, as shown in line 3 of Listing 7, is probably fine. This checks whether the domain expires within 30 days or the certificate expires within 10 days, which should give you enough time to address the issue. Unfortunately, at the time of writing, Gatus doesn't support domain expiration checks for all top-level domains. For instance, checks for a .eu domain always fail.
Listing 7
Monitoring Domain and Certificate Expiration
01   - name: Web server domain and certificate
02     url: "https://koen.vervloesem.eu"
03     interval: 1h
04     conditions:
05       - "[DOMAIN_EXPIRATION] > 720h"
06       - "[CERTIFICATE_EXPIRATION] > 240h"
Grouping Checks
Most likely, you'll add various checks of different types for the same server or the same checks for related servers. Consequently, you may want to show these checks together. For this purpose, Gatus allows you to group multiple endpoints together on the dashboard. You just need to add a group key to the endpoint in Gatus' configuration file, with the group name as its value.
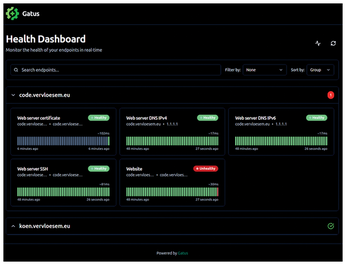
By assigning a group to all your endpoints and then sorting the endpoints by group in the user interface (in the top right), all endpoints within a group are collected under a heading with the group's name. If all endpoints in the group are healthy, the header shows a green checkmark; otherwise, it displays a red number representing the number of failed endpoints. All endpoints without a group appear in a default group named No Group.
Groups are interesting if you're dealing with a lot of endpoints. You can collapse and expand groups by clicking on their headers, and the green checkmark still shows you the group's health when it's collapsed (Figure 5). If you see a red number, simply expand the group to identify which endpoint is causing the failure. If you prefer sorting endpoints by group as a default, add the following lines to the configuration file:
ui:
  default-sort-by: group
Sending Email Alerts
Gatus supports dozens of alerting providers to notify you when an endpoint becomes unhealthy. You can find a comprehensive list on the project's GitHub page. In this article, I'll demonstrate configuring alerts for email and ntfy.
For email alerts, include the section from Listing 8 in Gatus' configuration file. Adjust the settings to match your chosen SMTP provider. For each endpoint that will receive these email alerts, add the following:
alerts:
      - type: email
Listing 8
Configuring Email Alerts
01 alerting:
02   email:
03     from: "from@example.com"
04     username: "from@example.com"
05     password: "hunter2"
06     host: "mail.example.com"
07     port: 587
08     to: "recipient1@example.com,recipient2@example.com"
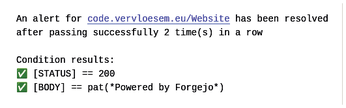
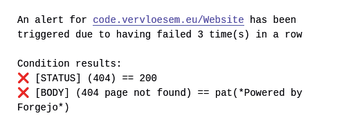
By default, Gatus sends an alert after an endpoint fails three times in a row (Figure 6). You can customize this setting for individual endpoints and modify other alert characteristics (see Listing 9 for an example). Notably, you can also receive an alert when a failure is resolved (Figure 7). The full details are documented on Gatus' GitHub page [2].
Listing 9
Email Alert Configuration
01 endpoints:
02   - name: example
03     url: "https://example.org"
04     conditions:
05       - "[STATUS] == 200"
06     alerts:
07       - type: email
08         description: "healthcheck failed"
09         failure-threshold: 3
10         success-threshold: 2
11         send-on-resolved: true
If you want to use a specific alert configuration for all endpoints using the same alert type, define the default values within the alert type's configuration, as shown in Listing 10.
Listing 10
Default Email Alert Configuration
01 alerting:
02   email:
03     from: "from@example.com"
04     username: "from@example.com"
05     password: "hunter2"
06     host: "mail.example.com"
07     port: 587
08     to: "recipient1@example.com,recipient2@example.com"
09     default-alert:
10       send-on-resolved: true
« Previous 1 2 3 Next »
Buy this article as PDF
(incl. VAT)
Buy Linux Magazine
Subscribe to our Linux Newsletters
Find Linux and Open Source Jobs
Subscribe to our ADMIN Newsletters
Support Our Work
Linux Magazine content is made possible with support from readers like you. Please consider contributing when you’ve found an article to be beneficial.

News
-
AI Fixes Linux Bottlenecks Using “Hideous” Code
A Linux developer used AI to fix bottlenecks that caused problems when building the kernel. The resulting AI-generated code needed a lot of work.
-
Advanced Video Coding Still Under Patent
Brazilian patent BRPI0109962B1 has expired, which means that DivX and Xvid are no longer problematic for Linux, but it doesn’t mean that video is all of a sudden fully unleashed.
-
2,000 Vulnerabilities per Linux Release
Thanks to AI bug hunters, the Linux kernel is seeing record numbers of vulnerabilities, and it's overwhelming developers.
-
Linux Exempt from California’s Age Verification Law
So long as Linux is distributed under the GPL, MIT, BSD, and Apache licenses, the OS is exempt from being required to verify the age of its users in California.
-
Roll Out the Cake: Linux Turns 35
35 years ago, a Finnish student began a humble project that would forever change the course of technology.
-
China Switching from Windows to Linux
China has ordered several government agencies to drop a Chinese-developed version of Windows 10 in favor of either KylinOS or UOS.
-
Pine64 Halts Production of Linux Devices
With continued DRAM and eMMC shortages, Pine64 has decided to discontinue production of Linux devices.
-
The Bullet-Proof KDE Software Initiative Is Coming
KDE, Techpaladin, and Kubuntu Focus have announced a new initiative that will provide at least three years of support for KDE Plasma 6.6 LTS and related software.
-
Linux Mint Shares a Possible Kernel Cleanup Solution
For those on Linux Mint who like to keep multiple kernels around but don't want them to take up too much space, you might be getting a new automated tool.
-
CachyOS Gets an Update
CachyOS August 2026 release is now available with the latest version of KDE, some new features, and plenty of improvements.