Consolidating Logs with Logstash
Collect and Analyze System Data from a Single Interface
ByWhen something goes wrong on a system, the logfile is the first place to look for troubleshooting clues. Logstash, a log server with built-in analysis tools, consolidates logs from many servers and even makes the data searchable.
If anything goes wrong on an enterprise network, the admin has to find and fix the problem quickly. Finding the information typically isn’t a problem – most IT systems produce a steady flow of system log entries and error messages – but evaluating this information correctly in complex networks with many devices, systems, and servers is often easier said than done.
One problem is the amount of information produced. On the one hand, a tool like the Pacemaker Cluster Manager is particularly verbose, producing many times the output needed. With Apache, on the other hand, data can end up going too many places if the admin sets it up to log each virtual host separately. On web servers that serve many customers, a vast number of logfiles accumulate, which means that debugging specific problems for an individual user can be an endless task.
Cloud computing environments that rely on OpenStack, CloudStack, or other cloud platforms rarely have fewer than 20 servers, and proliferation of server logs is proportional to the number of server systems.
The classic solution is for the log server to collect logs on a central system, rather than leaving them scattered across the network. This approach helps you avoid the need for excessive typing when navigating between servers via SSH. Some logfiles even index the logs for fast and convenient searching. Commercial tools like Splunk provide this kind of value-added log service.
The open source community’s answer to these commercial log tools is Logstash, a central logging service that offers an option for searching existing log entries through a web interface.
Logstash and Its Helpers
Strictly speaking, Logstash alone does not ensure meaningful and centralized management of logfiles. To perform its tasks as promised, Logstash needs some assistance. Logstash itself is a Java application, and despite all the prejudices that administrators have against Java – justified or not – the Logstash developers’ decision to go with Java was well founded. Because Java is also installed on Windows as a matter of course, Logstash can include Windows logfiles in its collection; this would be difficult to achieve with other Rsyslog services in many cases.
A Logstash installation that extends over more than one server consists of at least five different services. The central role is played by Logstash’s own components: The shipper – basically a client running on each target system – collects log messages. In the next step, it sends them to the indexer, which interprets and processes the log messages as specified by the admin. The host on which the indexer is found generally also runs the Logstash web server, which offers admins a search box for logfiles. In the background, two other services that do not directly belong to Logstash but are important for its function go about their duties: the Redis message broker and the ElasticSearch storage and search environment.
Redis is the focal point for communication between the shipper and the indexer. The Logstash instances on each server deliver their messages to the Redis server, where the Logstash indexer retrieves them in the next step. ElasticSearch, also a Java application, builds the index in the background and provides the interface to which the Logstash web server forwards search requests from the web interface.
Modular Design
One major advantage of Logstash is its diversity, which arises from its modular design and makes the tool very flexible: Until a few months ago, for example, it was common for Logstash installations to use an AMQP broker in place of Redis – RabbitMQ being the typical choice.
However, the amqp module for Logstash was not maintained very well, nor was it particularly popular with Logstash developers. The decision to switch to a different broker was implemented very easily because only the interface to the messaging broker needed to be coded. Meanwhile, the Redis connector works perfectly and RabbitMQ has become a relic of the past.
No Limits
Elsewhere, Logstash imposes virtually no limits on the administrator’s creativity: The tool not only offers the ability to archive log entries via defined filters but also to interpret them because the individual log entries are indexed and searchable.
For example, on request, Logstash manages HTTP logs, enabling systematic searching later in the web interface for all possible queries that have caused an “internal error.” Applied to Pacemaker, for example, this means admins could expressly search for Pacemaker log messages with an ERROR prefix.
Filters also can be designed to remove various entries from log records completely. For example, if you want to keep classic syslog – MARK – messages out of your log archive, you only need to modify the Logstash shipper configuration.
Test Setup
If you want to try out Logstash, you are in luck. Contrary to claims on the web, installation is by no means a Herculean task. Just make sure to clarify beforehand which role you are assigning to which host. Once it is clear which host the Redis server and ElasticSearch and the Logstash indexer will be running, you are ready to go. The following example is based on Ubuntu 12.04 but also works on Debian. RPM packages for Redis and ElasticSearch for typical enterprise distributions are also available on the web, including RHEL and SLES.
How easy it is to install Redis depends largely on whether Redis server packages exist for your system. On Ubuntu, a simple
apt-get install redis-server
installs the components. Afterwards, it is advisable to modify the 127.0.0.1 bind entry in /etc/redis/redis.conf so that it contains the IP address of the host; otherwise, Redis connects to the local host, which prevents other hosts from delivering their Logstash messages directly to Redis. Those who value security should define a password for access via the requirepass directive in redis.conf.
Installing ElasticSearch
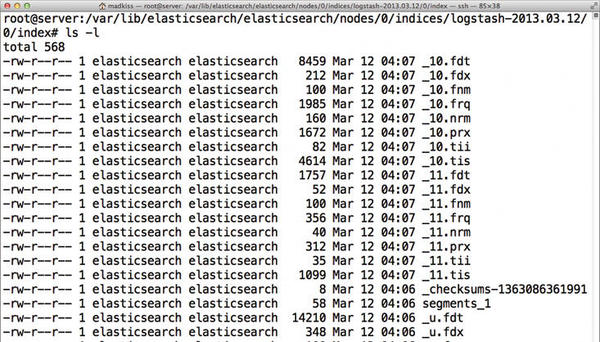
ElasticSearch (Figure 1) is a Java application like Logstash; unfortunately, none of the packages are available in Ubuntu.
Fortunately, help is available from Upstream, which provides a pre-built .deb package for Ubuntu on its website; it can also be installed with dpkg -i. The command initially returns an error message because of dependencies that are not met. After issuing the apt-get -f install command, ElasticSearch is ready.
By default, ElasticSearch also listens on 127.0.0.1, so an indexer must run on the same host. If you want ElasticSearch and the Logstash index service to run on different hosts, you will find the necessary switches in /etc/elasticsearch/elasticsearch.yml; they go by the names network.bind_host and network.host.
Shipping
Next, you must configure Logstash itself. It is important that Logstash does not come in the form of individual Java libraries for the client and server, but as a large file for all services. The tasks a Logstash instance performs ultimately depend on the content of the file the tool uses as a source for its configuration. After downloading the Logstash JAR file [4] (when this issue went to press, 1.1.9 was the latest version), you only need to choose the right parameters.
For a shipper, your shipper.conf file should appear as in Listing 1.
Listing 1: shipper.conf
01 input {
02  file {
03    type => "syslog"
04
05    # Wildcards work here :)
06    path => [ "/var/log/messages", "/var/log/
07 syslog", "/var/log/*.log" ]
08  }
09  file {
10    type => "apache-access"
11    path => "/var/log/apache2/access.log"
12  }
13
14  file {
15    type => "apache-error"
16    path => "/var/log/apache2/error.log"
17  }
18 }
19
20 output {
21  stdout { debug => true debug_format => "json"}
22  redis { host => "192.168.122.165" data_type =>
23 "list" key => "logstash" }
24}
With this configuration, Logstash would send the messages from the syslog files and from Apache to the indexer in the “default” virtual domain. The host with the indexer in this example is 192.168.122.165.
The key in line 22 might be a little confusing; it does not refer to a key created for authentication purposes, but to the value used by Redis as the name of the Logstash queue. With this configuration file, the
java -jar logstash-1.1.9-monolithic.jar agent -f shipper.conf
command would start Logstash.
Indexing
Setting up the indexer is not complicated either if you begin with a suitable configuration (Listing 2).
Listing 2: Indexer.conf
01 input {
02  redis {
03    host => "192.168.122.165"
04    type => "redis-input"
05    data_type => "list"
06    key => "logstash"
07    format => "json_event"
08 }
09 }
10 output {
11 elasticsearch {
12    host => "192.168.122.165"
13 }
14}
The Logstash configuration is thus divided into input and output blocks, which – as the name suggests – specify how the particular service gets and where it forwards its news.
The indexer begins its daily work with the command:
java -jar logstash-1.1.9-monolithic.jar agent -f indexer.conf
In contrast to the shipper, the indexer produces virtually no output of its own in the standard output channel, so if all is calm there, you have no reason to worry.
Serving
Finally, you need the Logstash web server itself; it does not need its own configuration file and can be started with:
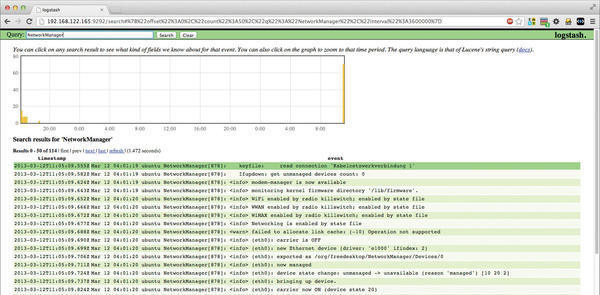
java -jar logstash-1.1.9-monolithic.jar web --backend elasticsearch://192.168.122.165/After this runs, you should be able to log in immediately to the Logstash system on port 9292 (Figure 2). In this example, the entire address would be http://192.168.122.165:9292.
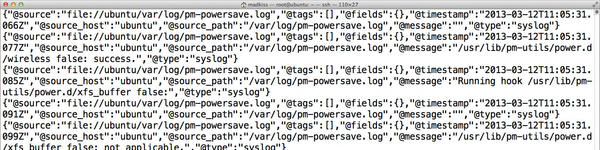
Directly after the first launch, log messages should begin to arrive (Figure 3); alternatively, you can verify the process via the search box. This basically completes the main steps of the Logstash installation.
Sysops have the freedom to embellish the setup to suit their own needs. For example, you will typically want to run the Logstash shipper on all systems at startup, which means creating a matching init script. (If you want to avoid the work, you can find predefined scripts for this on the web.)
Creating application-specific filters to leverage all of the solution’s options is also advisable. An overview of possible Logstash filter options, which also support regular expressions, can be found on the supplier’s website, together with extensive documentation.
Conclusions
Logstash is a very elegant solution to centralized logging. Chef cookbooks and Puppet recipes are already available, which is especially useful to admins who maintain large computer farms and work with centralized configuration file management. Logstash can be retrofitted very easily in such setups. However, Logstash really comes into its own when searching logs. Admins who have searched manually through tens of thousands of lines will find troubleshooting with Logstash a real eye-opener. Only admins with a pronounced allergy to Java will fail to appreciate it.
The Author
Martin Gerhard Loschwitz is the principal consultant with Hastexo, where he focuses on high-availability solutions. In his leisure time, he maintains the Linux Cluster stack for Debian GNU/Linux.
Subscribe to our Linux Newsletters
Find Linux and Open Source Jobs
Subscribe to our ADMIN Newsletters
Support Our Work
Linux Magazine content is made possible with support from readers like you. Please consider contributing when you’ve found an article to be beneficial.

News
-
KDE Linux Drops AUR
KDE Linux developers have dropped the Arch User Repository from the build pipeline due to security concerns; other distributions should consider doing the same.
-
California May Exempt Linux from Its Age-Verification Law
After backlash from the Linux community, California may be backing off on its promise to force all operating systems to verify age, but one platform may still have to comply.
-
Another Logic Bug Found in Linux Kernel
Qualys has discovered a vulnerability in the Linux kernel that can be used to elevate standard user privileges.
-
Ubuntu Core 26 Offers Game-Changing Enterprise Features
Ubuntu Core 26 could be a game-changer for organizations looking for increased security and reliability.
-
AI Flooding the Linux Kernel Security Mailing List
AI is giving Linus Torvalds a headache, but not in the way you might think.
-
Top Priorities for Open Source Pros Seeking a New Job
Professional fulfillment tops the list, according to LPI report.
-
Container-Based Fedora Hummingbird Designed for Agent-First Builders
Fedora Hummingbird brings the same approach to the host OS as it does to containers to level up security.
-
Linux kernel Developers Considering a Kill Switch
With the rise of Linux vulnerabilities, the kernel developers are now considering adding a component that could help temporarily mitigate against them… in the form of a kill switch.
-
Fedora 44 Now Gaming Ready
The latest version of Fedora has been released with gaming support.
-
Manjaro 26.1 Preview Unveils New Features
The latest Manjaro 26.1 preview has been released with new desktop versions, a new kernel, and more.