The sys admin's daily grind: SparkFun
Trouble in the Air
Is your neighbor burning the wrong kind of wood or did a couple of VWs just pass by your house? Charly finds out with a sensor. For an attractive approach to visualizing boring measurement figures, you can either use your own web server or rely on a specialized service like SparkFun.
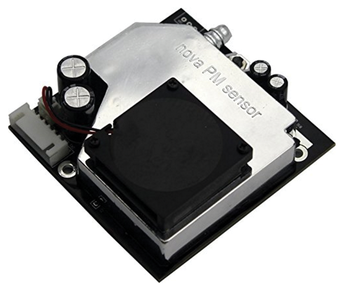
I ordered a particulate matter sensor from smog-experienced China (Figure 1), connected it to a Raspberry Pi, and can now see with up-to-the-minute accuracy when a neighbor has a fire in their wood-burning stove and even tell if the wood was properly dried. I use RRDtool to create illustrative graphs from the particulate matter readings that I get once every minute and upload them to my web server [1].

I could even do without the web server, because number of services handle storage and visualization of measurement data for you, if so desired. One of them, SparkFun, lets you store your data simply with an HTTP call.
[...]
Buy this article as PDF
(incl. VAT)
Buy Linux Magazine
Subscribe to our Linux Newsletters
Find Linux and Open Source Jobs
Subscribe to our ADMIN Newsletters
Support Our Work
Linux Magazine content is made possible with support from readers like you. Please consider contributing when you’ve found an article to be beneficial.

News
-
Manjaro 26.0 Primary Desktop Environments Default to Wayland
If you want to stick with X.Org, you'll be limited to the desktop environments you can choose.
-
Mozilla Plans to AI-ify Firefox
With a new CEO in control, Mozilla is doubling down on a strategy of trust, all the while leaning into AI.
-
Gnome Says No to AI-Generated Extensions
If you're a developer wanting to create a new Gnome extension, you'd best set aside that AI code generator, because the extension team will have none of that.
-
Parrot OS Switches to KDE Plasma Desktop
Yet another distro is making the move to the KDE Plasma desktop.
-
TUXEDO Announces Gemini 17
TUXEDO Computers has released the fourth generation of its Gemini laptop with plenty of updates.
-
Two New Distros Adopt Enlightenment
MX Moksha and AV Linux 25 join ranks with Bodhi Linux and embrace the Enlightenment desktop.
-
Solus Linux 4.8 Removes Python 2
Solus Linux 4.8 has been released with the latest Linux kernel, updated desktops, and a key removal.
-
Zorin OS 18 Hits over a Million Downloads
If you doubt Linux isn't gaining popularity, you only have to look at Zorin OS's download numbers.
-
TUXEDO Computers Scraps Snapdragon X1E-Based Laptop
Due to issues with a Snapdragon CPU, TUXEDO Computers has cancelled its plans to release a laptop based on this elite hardware.
-
Debian Unleashes Debian Libre Live
Debian Libre Live keeps your machine free of proprietary software.

